Fig. 8.
Download original image
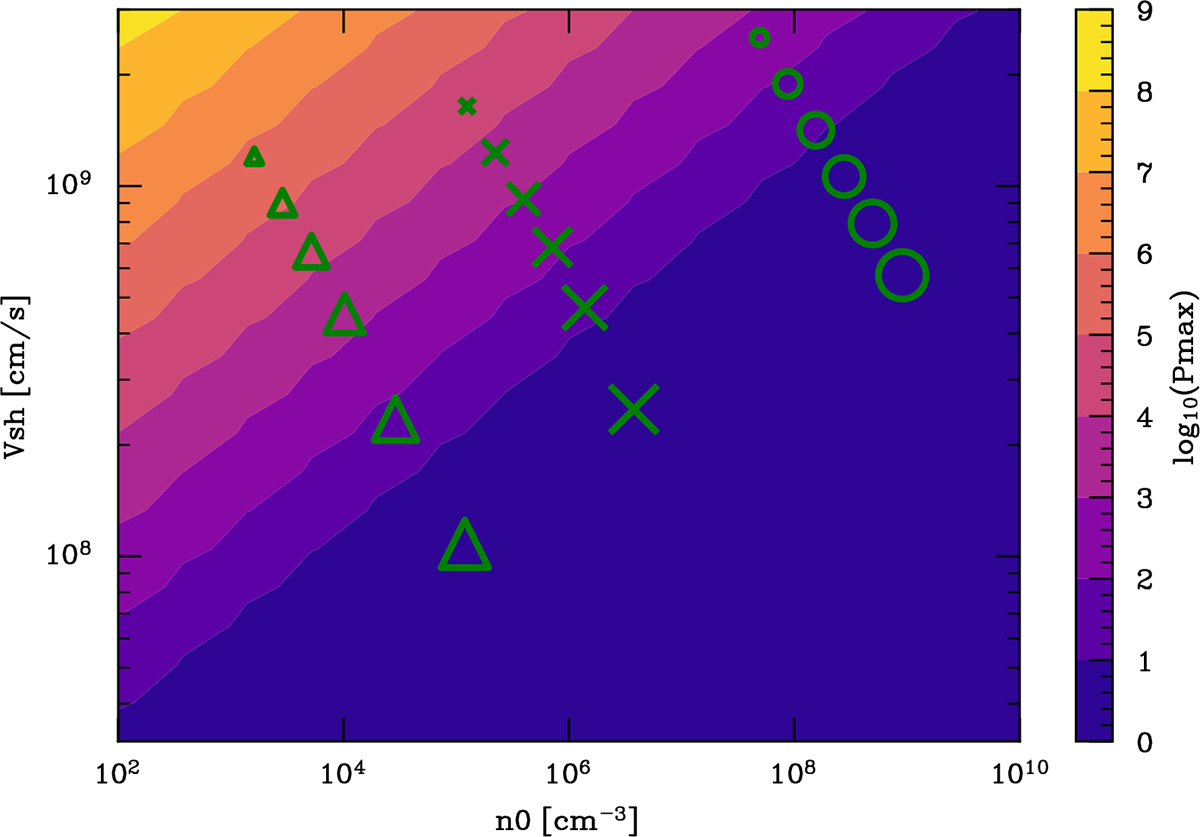
Maximum momentum of accelerated particles at a young SNR shock expanding in the dense wind of the progenitor star, as a function of density and shock velocity. The green circles, crosses, and triangles show the typical values reached 1 day, 1 month, and 1 year after the SN explosion, respectively. The size of the symbols increases with Ṁ from 10−5 to 1 M⊙/yr.
Current usage metrics show cumulative count of Article Views (full-text article views including HTML views, PDF and ePub downloads, according to the available data) and Abstracts Views on Vision4Press platform.
Data correspond to usage on the plateform after 2015. The current usage metrics is available 48-96 hours after online publication and is updated daily on week days.
Initial download of the metrics may take a while.