| Issue |
A&A
Volume 704, December 2025
|
|
|---|---|---|
| Article Number | A128 | |
| Number of page(s) | 6 | |
| Section | Astrophysical processes | |
| DOI | https://doi.org/10.1051/0004-6361/202555080 | |
| Published online | 05 December 2025 | |
Accounting for the absence of anomalous microwave emission in the M 31 halo
1
Department of Mathematics and Physics “Ennio De Giorgi”, University of Salento, Via per Arnesano, I-73100 Lecce, Italy
2
INFN, Sezione di Lecce, Via per Arnesano, I-73100 Lecce, Italy
3
INAF, Sezione di Lecce, Via per Arnesano, I-73100 Lecce, Italy
4
Department of Physics and Astronomy, School of Natural Sciences, National University of Sciences and Technology, H-12, 44000 Islamabad, Pakistan
⋆ Corresponding author: This email address is being protected from spambots. You need JavaScript enabled to view it.
Received:
8
April
2025
Accepted:
14
October
2025
Abstract
The discovery of a temperature asymmetry in the cosmic microwave background (CMB) data towards various galaxies is enabling a deeper comprehension of galactic halos. Estimating the fraction of missing baryons in the halos is a crucial step forward, but it relies on understanding the real cause of the observed CMB temperature asymmetry, to which many effects might contribute. We analysed the contribution played by the anomalous microwave emission (AME) from halo dust grains in the halo of the M 31 galaxy. Assuming dust grains to be either amorphous carbon or silicates, with sizes ranging from 0.01 μm to about 0.3 μm and mass in the range of 10−14 − 10−13 g, we estimated the total mass, distribution, and diffuse emission in the 100 μm band of the infrared astronomical satellite (IRAS). We then estimated the temperature asymmetry induced by the rotation of the M 31 halo and compared the obtained values with the Planck’s spectral matching independent component analysis (SMICA)-processed data. We find that the AME cannot account for the measured CMB temperature asymmetry, with its contribution constrained to ≲7%, thereby indicating that additional physical mechanisms must be responsible for the observed signal.
Key words: galaxies: halos / galaxies: individual: M 31
© The Authors 2025
 Open Access article, published by EDP Sciences, under the terms of the Creative Commons Attribution License (https://creativecommons.org/licenses/by/4.0), which permits unrestricted use, distribution, and reproduction in any medium, provided the original work is properly cited.
This article is published in open access under the Subscribe to Open model. This email address is being protected from spambots. You need JavaScript enabled to view it. to support open access publication.
1. Introduction
The analysis of cosmic microwave background (CMB) data from the WMAP and Planck has revealed a notable temperature asymmetry, ranging between about 50 and 80 μK towards the halos of several nearby edge-on spiral galaxies, including M 31, M 33, M 81, M 82, Centaurus A, M 104, and M 90 (De Paolis et al. 2014, 2015; Gurzadyan et al. 2015; De Paolis et al. 2016; Gurzadyan et al. 2018; De Paolis et al. 2019, 2025). This asymmetry extends up to galactocentric distances ∼100 kpc and is observed to be frequency-independent, strongly indicating a Doppler-induced origin due to the galactic halos rotation. Several physical mechanisms have been proposed to explain this phenomenon: (i) the rotational kinetic Sunyaev-Zeldovich (rkSZ) effect arising from the motion of hot ionized gas in rotating halos (Zorilla Matilla & Haiman 2020; ii) synchrotron radiation produced by fast-moving cosmic-ray electrons in magnetic fields (Dolag & Enßlin 2000; iii) free-free (bremsstrahlung) emission from hot electrons scattering off ions (Sun & Reich 2010; iv) anomalous microwave emission (AME) from spinning dust grains present in the interstellar medium, including in galactic halos (Erickson 1957; Hoyle & Wickramasinghe 1970; Kogut et al. 1996; Leitch & Readhead 2013); and (v) thermal emission from cold or virialized clouds in the galactic halo, which may contain both gas and dust components (De Paolis et al. 1995; Qadir et al. 2019; Tahir et al. 2019; Planck Collaboration XI 2014).
Currently, option (v) seems to provide the most likely explanation for the observed temperature asymmetry, but to verify this option, a precise estimate of the contribution from the other effects is needed. The rkSZ effect may be relevant on the scale of galaxy clusters, where the hot diffuse gas can reach temperatures exceeding a few times 107 K and sizes can be of a few megaparsec (Cooray & Chen 2002; Altamura et al. 2023); on the scale of galactic halos, it certainly plays a less important role (Zorilla Matilla & Haiman 2020). In the case of M 31, the hot diffuse gas is primarily confined to the inner regions, with X-ray observations indicating its dominance within a radius of approximately 2.5 kpc, where it extends vertically above the disk and traces the bulge emission (Li & Wang 2007). The stellar halo of M 31, in contrast, becomes increasingly prominent at larger galactocentric radii and has been detected at projected distances exceeding 175 kpc, corresponding to about two-thirds of the galaxy’s virial radius (Gilbert et al. 2014).
Recently, Tahir et al. (2022) estimated the rkSZ-induced temperature asymmetry, in which the value of the estimated ΔT was in the range 1.16 × 10⁻¹ μK–7.89 × 10⁻² μK within a galactocentric distance of 21.4 − 108.3 kpc. However, the observed temperature asymmetry in Planck’s spectral matching independent component analysis (SMICA) data towards the M 31 halo is in the range of 2.66 μK–21.4 μK. That means that the rkSZ effect certainly plays a minor role since it can contribute only up to about 4.3% to the observed temperature asymmetry towards the M 31 halo.
Considering effect (iv), AME from dust grains remains one of the less well-understood galactic foregrounds. Its phenomenological modelling has been advanced by Ali-Haïmoud (2013), and Zhang & Chluba (2025), while proposed carriers – ultra-small grains, polycyclic aromatic hydrocarbons (PAHs), and magnetic nanoparticles – continue to be explored (Hensley et al. 2016). The presence of AME has now been reliably detected in Galactic and extragalactic environments by Planck Collaboration XXV (2015), Fernández-Torreiro et al. (2023), and Murphy et al. (2010).
Specifically for M 31, AME has previously been investigated in the central and disk regions by Planck Collaboration XXV (2015), who reported tentative excess microwave emission possibly associated with spinning dust. Tibbs et al. (2012) and Browne et al. (2019) analysed localized AME features in M 31. Previous studies of AME have typically focussed on resolved regions within galaxies, such as star-forming areas or the central bulge. In contrast, integrated - whole-galaxy -analyses are less common. An example of such a study is the detection of AME in M 31 using Q-U-I Joint Tenerife-Multi-Frequency Instrument (QUIJOTE-MFI) data (Fernández-Torreiro et al. 2024). Additionally, upper limits for AME in several entire galaxies have been reported in Bianchi et al. (2022). These whole-galaxy investigations provide valuable constraints on AME on global scales, complementing the more localized studies. Observational correlations between AME and thermal dust emission have been found in the Milky Way and external galaxies, including M 31 (Planck Collaboration XXV 2015; Tibbs et al. 2012; Dickinson et al. 2018), supporting a common origin. Both are associated with interstellar dust grains and both can allow dust-rich regions to be traced. Thermal dust emits predominantly at higher frequencies (≳100 GHz) and is generally associated with large grains in equilibrium with the interstellar radiation field, whereas AME is believed to arise from the electric dipole radiation of rapidly rotating very small grains, particularly PAHs, which emit in the 10–60 GHz range (see, e.g., Ysard et al. 2022). Observational correlations have been found between AME and thermal dust emission (Cepeda-Arroita et al. 2020; Fernández-Torreiro et al. 2023).
In contrast to earlier studies that focussed on the M 31 disk and bulge, the present paper aims to investigate the contribution of AME to the extended halo of the M 31 galaxy, where the observed temperature asymmetry reaches several tens of μK across all Planck bands, extending up to about 10° from the galaxy centre, corresponding to about 135 kpc. The dust mass Md in the M 31 galaxy derived from observations amounts to about 107 M⊙–108 M⊙ (Draine 2003; Imara et al. 2018); the more robust direct estimate within 25 kpc is Md(R ≤ 25 kpc)≃5.4 × 10⁷ M⊙, while the estimated gas mass within the same galactocentric distance amounts to about Mg ≃ 6.7 × 10⁹ M⊙ (Tamm et al. 2012). In this context, the dust-to-gas ratio, which could vary across the galaxy decreasing from the centre outwards, should be approximately 0.008 while the ratio of the dust mass with respect to the full M 31 virial mass (about 1012 M⊙ up to 200 kpc) would be ≃5.4 × 10⁻⁵ or slightly higher. An estimate of the amount of baryons in the M 31 circumgalactic medium within its virial radius was recently attempted using γ-ray observations (Zhang et al. 2021) , obtaining about a few times 1010 M⊙. One could expect that AME might not be important in galactic halos due to the limited amount of dust that should be present in those regions. Therefore, it is likely that AME does not account for the temperature asymmetry in the microwaves detected by the Planck satellite (De Paolis et al. 2014). However, it is worth investigating this issue since the detection of AME emission in galactic halos should yield important information about the amount and distribution of spinning small dust grains in those regions.
Dust grains in galactic halos are thought to originate in the disk and be transported outwards by radiation pressure. Their diffusion into the halo depends on factors such as the galaxy’s mass, the temperature of the hot-gas halo, and the radiation pressure coefficients. Lighter grains such as graphite accelerate more efficiently than heavier silicate grains (Ferrara et al. 1991). However, not all grains reach the halo due to the counteracting effects of strong radiation pressure and galactic magnetic fields (Hirashita & Lin 2020). In this study, we assume that M 31 halo dust consists primarily of amorphous carbon and silicates. In Sects. 2 and 3 we explain how we modelled the spatial distribution of halo dust grains, estimated their total infrared (IR) emission and temperature using IRAS data within 135 kpc, and used this to constrain the grain size. In Sect. 4 we explain how we calculated the temperature asymmetry these grains could induce and compare it with the SMICA-processed Planck data (Planck Collaboration IV 2020). Our main findings are discussed in Sect. 5.
2. Distribution of halo dust grains
It has been proposed that AME is caused by very small dust grains that spin rapidly, emitting radiation at microwave frequencies (Ferrara & Dettmar 1994; Draine & Lazarian 1998). As a result, AME can be distinguished from other emission processes, such as synchrotron radiation or free-free emission. Furthermore, the AME spectral index, which increases at low frequency and then falls, is not well described by a single power law, whereas synchrotron radiation is characterized by a single power-law index ≃0.7 − 1.0, while free-free emission has a flat or slightly declining spectrum with spectral index ≃ − 0.1. Moreover, polarization in AME is negligible with respect to synchrotron emission (González-González et al. 2025). In addition, AME has been detected in the Planck 10–60 GHz frequency band, which exhibits a strong link to far-infrared (FIR) radiation (Planck Collaboration XXV 2015; Fernández-Torreiro et al. 2023) that is typically associated with the thermal emission from dust grains (Kogut et al. 1996; Leitch et al. 1997).
To estimate the AME contribution in the CMB data towards the M 31 halo, we followed Amekhyan et al. (2019) and assumed that the halo dust is distributed according to the Navarro-Frenk-White (NFW) density profile (Navarro et al. 1997), that is
 (1)
(1)
where f is the dust fraction with respect to the halo dark matter, r is the galactocentric radial distance, ρc = 1.74 × 10⁻² M⊙ pc−3 is the dark matter central density, and rc = 12.4 kpc is the M 31 halo core radius. Note that in our toy model, we assumed that the fraction f is constant throughout the whole M 31 halo, leaving the generalization of f to f(r) to future study. The dust mass within the projected radial distance R (with respect to the M 31 rotation axis) was estimated using the relation
 (2)
(2)
The dust mass density and the dust mass profiles in the M 31 halo are shown in Fig. 1. Setting f = 3.14 × 10⁻⁴, we obtained a consistent value for the halo dust mass obtained by Draine et al. 2013 within about 25 kpc. Following Tahir et al. (2022), the circular velocity of the halo dust grains can be estimated by
![Mathematical equation: $$ \begin{aligned} v_c(\le R) = \sqrt{\alpha \left[\ln \left(1+R/R_{\rm vir}\right)-\left(R/R_{\rm vir}\right)\left(1+R/R_{\rm vir}\right)^{-1}\right]}\, , \end{aligned} $$](/articles/aa/full_html/2025/12/aa55080-25/aa55080-25-eq3.gif) (3)
(3)
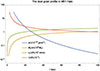 |
Fig. 1. M 31 halo profiles of the dust grain density (blue curve), dust mass (orange curve), circular velocity (green curve), and optical depth (red curve). |
where α = (4πGrc2ρcRvir)/R, G is Newton’s gravitational constant, and Rvir ≃ 200 kpc is the M 31 virial radius. The radial profile of the dust rotational velocity in the M 31 halo obtained by Eq. (3) is shown in Fig. 1 and the asymptotic value of the circular velocity is found to be ≃230 km s−1. However, the values of the circular velocity given by Eq. (3) have to be considered as upper limits to the actual bulk rotational speed of the M 31 halo, since that equation derives from the assumption that the centrifugal equilibrium holds, an assumption that might not apply, in general, to galactic halos.
3. Infrared emission from halo dust towards M 31
Observations of the M 31 galaxy have revealed the presence of cold dust extending beyond the central regions into the outer disk and halo. Infrared observations, particularly by IRAS and the Infrared space observatory (ISO), have allowed the detection of dust with a temperature of about 16 K in the M 31 outer regions (Haas et al. 1998). These authors mapped the cold dust in M 31 using ISO 175 μm observations, revealing a dominant dust ring at approximately 10 kpc and a fainter outer ring at about 14 kpc. They found that the bulk dust temperature is about 16 K, significantly colder than the 21–22 K estimated from IRAS data within 25 kpc. Spectral energy distribution analysis confirmed the presence of two dust components: a cold dust population (at a temperature of about 16 K) and a warmer component (with T ≃ 45 K).
The aim of this section is to explain how we used IRAS dust excitation data within 10 deg (≃135 kpc) from the M 31 centre to estimate the radiative flux from the halo dust grains and map the dust temperature in the M 31 halo. We used the dust extinction service of IRAS, which is an interactive service that uses the maps of Schlegel, Finkbeiner, and Davis (SFD), to return extinction along the line of sight through the considered galaxy for 100 μm. In this analysis, the dust temperature was not directly computed from the IRAS 100 μm band alone; rather, it was inferred using the temperature-corrected dust emission map provided by the SFD98 model (Schlegel et al. 1998). We combined the SFD98 model high resolution at 100 μm IRAS maps with temperature estimates derived from the Cosmic Background Explorer/Diffuse Infrared Background Experiment (COBE/DIRBE) 100 μm and 240 μm bands, under the assumption that dust emission follows a modified blackbody spectrum with a fixed emissivity index β = 2. This allowed the construction of a full-sky temperature-corrected dust map that traces dust-column density more accurately. The corrections also involved careful subtraction of background components, including zodiacal light, which was modelled and removed using DIRBE’s seasonal variation, the cosmic infrared background (CIB), which was estimated from high-latitude sky regions, and instrumental systematics. Since the IRAS data alone lacked absolute calibration, we used the SFD98 model to recalibrate it using DIRBE data to ensure consistency.
The average temperature of the M 31 halo dust grain from the analysis is 17.7 ± 0.2 K. The radiative flux was estimated from the temperature-corrected IRAS 100 μm dust emission map provided by the SFD98 model and is shown in the right panel of Fig. 2, while in the left panel of the same figure the Planck SMICA map of the temperature excess within the 135 kpc region is given. The radiative flux from the M 31 halo is in the range of 7.08 × 10⁻⁸ − 1.54 × 10⁻⁷ erg s−1 cm−2 sr−1 within about 10 deg from the M 31 centre.
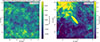 |
Fig. 2. Left panel: Planck’s SMICA map of the temperature excess within 135 kpc towards M 31. Right panel: IRAS dust excitation map at 100 μm within 135 kpc. |
We modelled dust grain emission using the observations towards the M 31 halo by Habing et al. (1984), Hirashita & Lin (2020), Yershov et al. (2020) in mid and FIR wavelengths, and assuming that the M 31 halo contains carbon and silicate grains with sizes a from 0.01 μm to 0.3 μm and mass ≃10−14 − 10−13 g. The dust grain optical depth τ within the M 31 galactocentric distance R can be estimated as (see Amekhyan 2019)
 (4)
(4)
Here, D = 744 kpc is the M 31 distance, Ω is the solid angle corresponding to the radial distance R, and κ is the absorption cross-section of the dust grains (in units of cm2 g−1), which is given by Amekhyan et al. (2019);
 (5)
(5)
Here, β ≃ 1 is the power-law index for amorphous molecules (Draine 2003), and νi = 300 GHz, and νf = 20 THz are the lower and upper FIR frequencies of IRAS (Habing et al. 1984), respectively. The optical depth obtained, up to 135 kpc from the M 31 centre, is shown in Fig. 1. As can be seen, the values obtained in the FIR band agree with those reported in Amekhyan et al. (2019). The density Φ(a, Td, ≤R), in units of erg s−1 cm−2 sr−1, can be estimated using the relation
 (6)
(6)
Here, mgr = (4/3)πa3ρgr is the mass of a single dust grain with density ρgr, that is, about 1 g cm−3 in the case of amorphous carbon or silicates, and radius a. The blackbody spectral radiance B(ν, Td) integrated over the frequency is given by
 (7)
(7)
where h is Planck’s constant, kB is the Boltzmann constant, c is the speed of light, and Td is the dust grain temperature. The values obtained for the radiative flux Φ are listed in Table 1 (column 2) for a range of grain sizes (column 1). These results align closely with estimates derived from the IRAS dust excitation data and analysis by Battistelli et al. (2019). It should be noted that Battistelli et al. (2019) do not explicitly report radiative flux values and their analysis is limited to the M 31 disk extension. Furthermore, their study was confined to an elliptical region of 91.5′×59.5′, which turns out to be approximately 42 × 27 kpc at the distance of M 31. This region is comparable only with the innermost radial region that we consider, that is, with a radius of 21.4 kpc. The average radiative flux within the 21.4 kpc region found by Battistelli et al. (2019) in all the Planck bands is 7.91 × 10⁻⁷ erg s−1 cm−2 sr−1. The average flux value that we obtained for the various grain sizes considered is of the same order of magnitude as the flux reported by Battistelli et al. (2019). However, we note that the modelled fluxes span approximately one order of magnitude depending on the grain size. In particular, smaller grains in the range of 0.01 − 0.06 μm yield fluxes that best reproduce the observed value, consistent with expectations that AME is dominated by very small spinning dust grains (see Table 1). As a result, this consistency in the underlying dust emission trends in both studies reinforces the interpretation that AME from spinning dust grains may be a viable mechanism across multiple galactic scales.
Estimated radiative flux within 135 kpc from M 31 halo dust grains.
4. Temperature asymmetry contribution by AME
In the previous section, we explain how we constrained the M 31 halo dust parameters. The temperature asymmetry in the CMB caused by AME from the rotation of the M 31 halo with circular speed vc can be estimated using the relation
 (8)
(8)
where nd(r, a) = ρ(r)/mgr(a) is the number density of the halo dust grains, ϕ is the azimuthal angle, i ≃ 77.5° is the inclination angle of the M 31 galaxy, σ is the grain cross-section, and the integral was performed along the line of sight (los). In Table 2 we give the values of the estimated temperature asymmetry induced by the AME effect (in the third column) for various grain sizes given in the first column, and compare them with the observed value of the temperature asymmetry given in the fourth column. The observed temperature asymmetry corresponds to the foreground-corrected SMICA-processed data. We note that the SMICA data were chosen because they are less contaminated by unresolved sources and other foregrounds at small angular scales compared to other available Planck maps (Planck Collaboration XII 2014; Planck Collaboration IV 2020). As can be seen, the estimated values of ΔT due to AME are much lower with respect to the asymmetry detected on the CMB data ranging between 50–80 μK. Hence, we can safely conclude that AME cannot account for the observed temperature asymmetry towards the M 31 halo.
Estimated temperature asymmetry induced by AME from dust grains in the M 31 halo.
Moreover, to establish the relative importance of the AME-induced temperature asymmetry in the inner region of the M 31 galaxy with respect to the halo, we considered the 1 − 10 kpc region in particular. The estimated AME-induced temperature excess ΔTest is in the range of 0.62 − 2.25 μK, for a = 0.01 μm down to ΔTest = 0.25 − 1.24 μK for a = 0.36 μm. It can be clearly seen, by comparing these values with those reported in the third column of Table 2, that the AME-induced temperature asymmetry is more significant in the inner regions of the M 31 galaxy and plays a minor role in the regions beyond about 20 kpc of the M 31 galaxy.
Finally, we should mention that we analysed the dependence of the radiative flux and the ΔT values on the dust grain temperature. We considered dust temperatures from 30 K to about 2.5 K. It was seen that in decreasing temperatures, the fraction f increases and, as a result, ΔT also increases. For example, for 30 K dust grains, we have f ≃ 10−5 and Φ in the range between 4.65 × 10⁻⁷ erg s−1 cm−2 sr−1 and 6.45 × 10⁻⁸ erg s−1 cm−2 sr−1, for grain sizes between 0.01 μm and 0.3 μm. Consequently, the temperature asymmetry ΔT is about 4.65 × 10⁻³ μK at 21.4 kpc to 5.65 × 10⁻² μK at 103.8 kpc. Similarly, for cold dust grain sizes between 0.01 μm and 0.3 μm at Td = 2.5 K we get f ≈ 10−1 while the radiative flux Φ is in the range of 2.31 × 10⁻⁷ − 4.78 × 10⁻⁷ erg s−1 cm−2 sr−1. Consequently, ΔT is about 1.89 × 10⁻² μK at 21.4 kpc to 20.45 × 10⁻² μK at 103.8 kpc. Therefore, the dust temperature seems to play a rather relevant role in the AME-induced temperature asymmetry. Nevertheless, even under these extreme cold-dust conditions, the AME contribution remains far below the observed level of CMB temperature asymmetry, which is limited to ≲7% of the measured effect.
5. Results and conclusions
The observed temperature asymmetry in CMB data towards various edge-on spirals has provided a novel approach to investigate and map halo dynamics and study either the disk or halo rotation, even if the true cause of this asymmetry is still unknown. Several theoretical effects could contribute, including the rkSZ effect, which has been analysed for the halos of M 31 and M 90 (Tahir et al. 2022; De Paolis et al. 2025). However, it has been found that this effect is minor, accounting for only about 1% of the observed temperature asymmetry. For this study, we explored the potential contribution of the AME from halo dust grains to the CMB temperature anisotropy towards the M 31 halo, assuming that the dust distribution follows the NFW profile and the dust circular velocity profile is given by Eq. (3).
To estimate the temperature asymmetry ΔT caused by dust grains, we constrained the grain size and temperature of the M 31 halo dust. We used the IRAS dust excitation data in the 100 μm band within 10 deg to estimate the temperature profile of the M 31 halo dust and the radiative flux Φ. These quantities are Td ≈ 17 K and Φ ≈ 10−8 erg s−1 cm−2 sr−1. The optical depth τ of the dust grains in the FIR band is in the range of 10−3 − 10−4 within about 135 kpc, consistent with that obtained by Amekhyan et al. (2019) in the microwave band.
We then estimated the expected temperature asymmetry ΔTest caused by AME as a function of the projected radial distance of the M 31 halo by using Eq. (8). We find that the AME contribution from halo dust at 17 K is variable from 0.3% to about 7% at most, and it can be considered negligible with respect to the measured ΔTobs (see Table 2).
Moreover, when comparing the central (< 20 kpc) and outer (> 20 kpc) regions, the AME signal is found to drop significantly. This behaviour closely follows the underlying dust density profile, which is expected since the AME distribution was modelled on it. In fact, this steep decline indicates that spinning dust emission is unlikely to be a significant component of the microwave sky beyond a certain galactocentric distance. A similar trend is reported by Fernández-Torreiro et al. (2024), who measured a reduction in the AME fraction when comparing two aperture sizes centred on M 31, one of 91.5′×59.5′ and a larger one of 100′×70′. Although the resolution of their data was not sufficient to consider the two regions fully independent, the larger aperture shows a weaker AME contribution relative to other emission mechanisms. Together these findings support the conclusion that AME is strongly concentrated in the inner region of M 31. More importantly, our quantitative analysis shows that, even under the most conservative assumptions, AME contributes ≲7% of the observed CMB temperature asymmetry at most.
On the other hand, previously it was shown (Tahir et al. 2022) that the rkSZ from the hot gas in the M 31 halo contributes less than about 1% to the observed temperature asymmetry in the Planck data. Both these findings make cold or virial clouds a stronger candidate than before to account for the temperature asymmetry revealed towards the M 31 halo.
Acknowledgments
FDP acknowledges partial support of the INFN Projects TAsP (Theoretical Astroparticle Physics) and EUCLID. NT would like to acknowledge the support by the National University of Sciences and Technology (NUST) Project no. NUST-24-41-78. Prof. Asghar Qadir and the anonymous referee are also deeply acknowledged.
References
- Ali-Haïmoud, Y. 2013, Adv. Astron., 2013, 462697 [NASA ADS] [Google Scholar]
- Altamura, E., Kay, S. T., Chluba, J., & Towler, I. 2023, MNRAS, 524, 2262 [NASA ADS] [CrossRef] [Google Scholar]
- Amekhyan, A. 2019, IJMPD, 28, 2040016 [Google Scholar]
- Amekhyan, A., Sargsyan, S., & Stepanian, A. 2019, MPLA, 34, 1950308 [Google Scholar]
- Battistelli, E. S., Fatigoni, S., Murgia, M., et al. 2019, ApJ, 877, L31 [Google Scholar]
- Bianchi, S., Murgia, M., Melis, A., et al. 2022, A&A, 658, L8 [NASA ADS] [CrossRef] [EDP Sciences] [Google Scholar]
- Browne, I. W. A., Ade, P. A. R., Angilé, F. E., et al. 2019, A&A, 631, A38 [NASA ADS] [CrossRef] [EDP Sciences] [Google Scholar]
- Cepeda-Arroita, R., Harper, S., Dickinson, C., et al. 2020, MNRAS, 503, 2927 [Google Scholar]
- Cooray, A., & Chen, X. 2002, ApJ, 573, 43 [NASA ADS] [CrossRef] [Google Scholar]
- De Paolis, F., Ingrosso, G., Jetzer, P., & Roncadelli, M. 1995, A&A, 299, 647 [NASA ADS] [Google Scholar]
- De Paolis, F., Gurzadyan, V. G., Nucita, A. A., et al. 2014, A&A, 565, L3 [NASA ADS] [CrossRef] [EDP Sciences] [Google Scholar]
- De Paolis, F., Gurzadyan, V. G., Nucita, A. A., et al. 2015, A&A, 580, L8 [NASA ADS] [CrossRef] [EDP Sciences] [Google Scholar]
- De Paolis, F., Gurzadyan, V. G., Nucita, A. A., et al. 2016, A&A, 593, A57 [NASA ADS] [CrossRef] [EDP Sciences] [Google Scholar]
- De Paolis, F., Gurzadyan, V. G., Nucita, A. A., et al. 2019, A&A, 329, A87 [Google Scholar]
- De Paolis, F., Gurzadyan, V. G., Kashin, A. L., et al. 2025, A&A, 694, L2 [NASA ADS] [CrossRef] [EDP Sciences] [Google Scholar]
- Dickinson, C., Ali-Haïmoud, Y., Barr, A., et al. 2018, New Astron. Rev., 80, 1 [CrossRef] [Google Scholar]
- Dolag, K., & Enßlin, T. A. 2000, A&A, 362, 151 [NASA ADS] [Google Scholar]
- Draine, B. T. 2003, ARA&A, 41, 241 [NASA ADS] [CrossRef] [Google Scholar]
- Draine, B. T., & Lazarian, A. 1998, ApJ, 508, 157 [NASA ADS] [CrossRef] [Google Scholar]
- Draine, B. T., Aniano, G., Krause, O., et al. 2013, ApJ, 780, 172 [NASA ADS] [CrossRef] [Google Scholar]
- Erickson, W. C. 1957, ApJ, 126, 480 [NASA ADS] [CrossRef] [Google Scholar]
- Fernández-Torreiro, M., Rubiño-Martín, J. A., Lápez-Caraballo, C. H., et al. 2023, MNRAS, 526, 1343 [Google Scholar]
- Fernández-Torreiro, M., Génova-Santos, R. T., Rubiño-Martín, J. A., et al. 2024, MNRAS, 527, 11945 [Google Scholar]
- Ferrara, A., & Dettmar, R. J. 1994, ApJ, 427, 155 [Google Scholar]
- Ferrara, A., Ferrini, F., Franco, J., et al. 1991, ApJ, 381, 137 [Google Scholar]
- Gilbert, K. M., Kalirai, J. S., Guhathakurta, P., et al. 2014, ApJ, 76, 2 [Google Scholar]
- González-González, R., Génova-Santos, R. T., Rubiño-Martín, J. A., et al. 2025, A&A, 695, A245 [NASA ADS] [CrossRef] [EDP Sciences] [Google Scholar]
- Gurzadyan, V. G., De Paolis, F., Nucita, A. A., et al. 2015, A&A, 582, A77 [NASA ADS] [CrossRef] [EDP Sciences] [Google Scholar]
- Gurzadyan, V. G., De Paolis, F., Nucita, A. A., et al. 2018, A&A, 309, A131 [Google Scholar]
- Haas, M., Lemke, D., Stickel, M., et al. 1998, A&A, 338, L33 [Google Scholar]
- Habing, H. J., Miley, G., Young, E., et al. 1984, ApJ, 278, L59 [NASA ADS] [CrossRef] [Google Scholar]
- Hensley, B. S., Draine, B. T., & Meisner, A. M. 2016, ApJ, 827, 45 [CrossRef] [Google Scholar]
- Hirashita, H., & Lin, C. Y. 2020, Planet. Space Sci., 104504, 104504 [Google Scholar]
- Hoyle, F., & Wickramasinghe, N. C. 1970, Nature, 227, 473 [Google Scholar]
- Imara, N., Loeb, A., Johnson, B. D., et al. 2018, ApJ, 854, 36 [NASA ADS] [CrossRef] [Google Scholar]
- Kogut, A., Banday, A. J., Bennett, C. L., et al. 1996, ApJ, 464, L5 [NASA ADS] [CrossRef] [Google Scholar]
- Leitch, E. M., & Readhead, A. C. S. 2013, Adv. Astron., 2013, 352407 [Google Scholar]
- Leitch, E. M., Readhead, A. C. S., Pearson, T. J., et al. 1997, ApJ, 486, L23 [NASA ADS] [CrossRef] [Google Scholar]
- Li, Z., & Wang, Q. D. 2007, ApJ, 668, L39 [Google Scholar]
- Murphy, E. J., Helou, G., Condon, J. J., et al. 2010, ApJ, 709, L108 [NASA ADS] [CrossRef] [Google Scholar]
- Navarro, J. F., Frenk, C. S., & White, S. D. M. 1997, ApJ, 490, 493 [Google Scholar]
- Planck Collaboration IV. 2020, A&A, 641, A4 [NASA ADS] [CrossRef] [EDP Sciences] [Google Scholar]
- Planck Collaboration XI. 2014, A&A, 571, A11 [NASA ADS] [CrossRef] [EDP Sciences] [Google Scholar]
- Planck Collaboration XII. 2014, A&A, 571, A12 [NASA ADS] [CrossRef] [EDP Sciences] [Google Scholar]
- Planck Collaboration XIII. 2016, A&A, 594, A13 [NASA ADS] [CrossRef] [EDP Sciences] [Google Scholar]
- Planck Collaboration XXV. 2015, A&A, 582, A28 [NASA ADS] [CrossRef] [EDP Sciences] [Google Scholar]
- Qadir, A., Tahir, N., & Sakhi, M. 2019, PRD, 100, 043028 [Google Scholar]
- Schlegel, D. J., Finkbeiner, D. P., & Davis, M. 1998, ApJ, 500, 525 [Google Scholar]
- Sun, X. H., & Reich, W. 2010, RAA, 10, 1287 [NASA ADS] [Google Scholar]
- Tahir, N., De Paolis, F., Qadir, A., et al. 2019, IJMPD, 28, 1950088 [NASA ADS] [CrossRef] [Google Scholar]
- Tahir, N., De Paolis, F., Qadir, A., et al. 2022, A&A, 644, A30 [Google Scholar]
- Tamm, A., Tempel, E., Tenjes, P., et al. 2012, A&A, 546, A4 [NASA ADS] [CrossRef] [EDP Sciences] [Google Scholar]
- Tibbs, C. T., Paladini, R., Compiegne, M., et al. 2012, MNRAS, 421, 2937 [Google Scholar]
- Yershov, V. N., Raikov, A. A., Lovyagin, N. Yu., et al. 2020, MNRAS, 492, 5052 [Google Scholar]
- Ysard, N., Miville-Deschenes, M.-A., Verstraete, L., & Jones, A. P. 2022, A&A, 663, A65 [NASA ADS] [CrossRef] [EDP Sciences] [Google Scholar]
- Zhang, Z., & Chluba, J. 2025, JCAP, 03, 038 [Google Scholar]
- Zhang, Y., Liu, R. Y., Li, H., et al. 2021, ApJ, 911, 58 [NASA ADS] [CrossRef] [Google Scholar]
- Zorilla Matilla, J. M., & Haiman, Z. 2020, Phys. Rev. D, 101, 083016 [NASA ADS] [CrossRef] [Google Scholar]
All Tables
Estimated temperature asymmetry induced by AME from dust grains in the M 31 halo.
All Figures
|
Fig. 1. M 31 halo profiles of the dust grain density (blue curve), dust mass (orange curve), circular velocity (green curve), and optical depth (red curve). |
| In the text | |
|
Fig. 2. Left panel: Planck’s SMICA map of the temperature excess within 135 kpc towards M 31. Right panel: IRAS dust excitation map at 100 μm within 135 kpc. |
| In the text | |
Current usage metrics show cumulative count of Article Views (full-text article views including HTML views, PDF and ePub downloads, according to the available data) and Abstracts Views on Vision4Press platform.
Data correspond to usage on the plateform after 2015. The current usage metrics is available 48-96 hours after online publication and is updated daily on week days.
Initial download of the metrics may take a while.