Fig. A.1.
Download original image
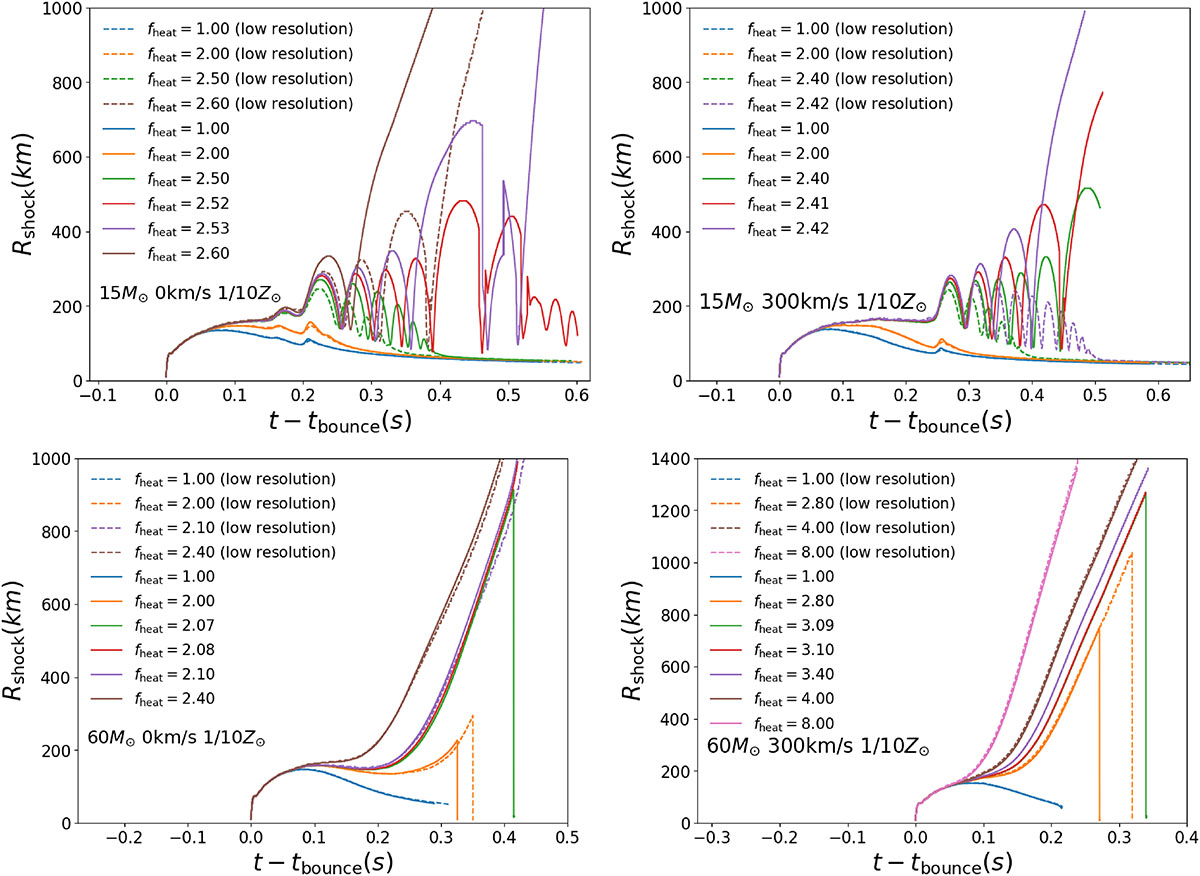
Shock wave radius evolution vs. explosion time tbounce for different fheat values. The simulations started with an iron core-collapse velocity of 1000 km s−1, where t = 0 corresponds to shock wave formation. Dashed curves depict simulations employing coarse numerical grids, while solid lines correspond to higher-resolution implementations. The top and bottom panels show 15 M⊙ and 60 M⊙ ZAMS masses respectively, with initial velocities Vini = 0 (left panels) and 300 km s−1 (right panels). All models have a metallicity of 1/10 Z⊙.
Current usage metrics show cumulative count of Article Views (full-text article views including HTML views, PDF and ePub downloads, according to the available data) and Abstracts Views on Vision4Press platform.
Data correspond to usage on the plateform after 2015. The current usage metrics is available 48-96 hours after online publication and is updated daily on week days.
Initial download of the metrics may take a while.