Fig. 1.
Download original image
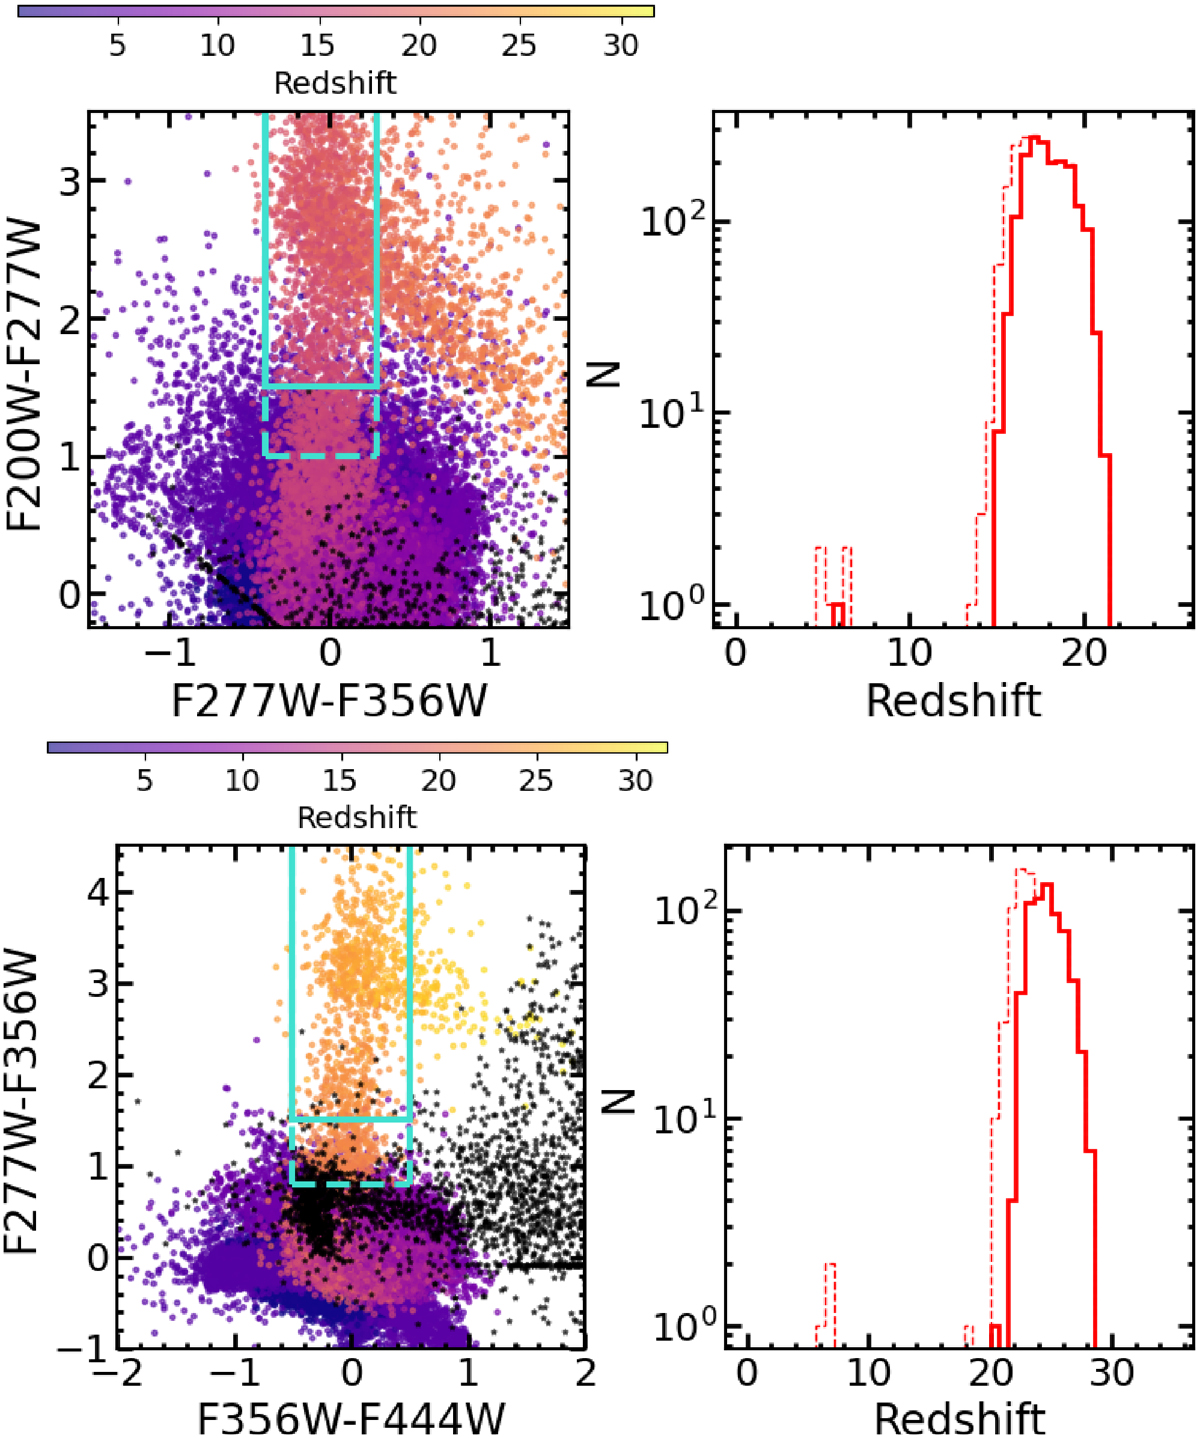
Colour selection diagrams (left panels) for the selection of galaxies at z ∼ 15 − 20 (top) and z ∼ 20 − 30 (bottom). The cyan solid lines enclose the regions in which the reference sample to estimate the LFs are selected. The cyan dashed lines enclose regions where the additional extended samples are selected. The relevant redshift distributions of the selected reference (extended) samples are shown in the right panels as continuous (dashed) histograms. The points colour-coded according to the relevant redshift show objects from a mock generated over an area of 0.12 sq. deg., with low-redshift populations generated through the EGG software (Schreiber et al. 2017). Black stars show the position of brown dwarf models from Marley et al. (2021). All fluxes were perturbed with realistic noise properties to reproduce the typical depth of the JADES-GS field. Similar diagrams have been analysed for all fields using both the EGG- and JAGUAR-based simulations described in Sect. 1.
Current usage metrics show cumulative count of Article Views (full-text article views including HTML views, PDF and ePub downloads, according to the available data) and Abstracts Views on Vision4Press platform.
Data correspond to usage on the plateform after 2015. The current usage metrics is available 48-96 hours after online publication and is updated daily on week days.
Initial download of the metrics may take a while.