| Issue |
A&A
Volume 704, December 2025
|
|
|---|---|---|
| Article Number | A158 | |
| Number of page(s) | 24 | |
| Section | Extragalactic astronomy | |
| DOI | https://doi.org/10.1051/0004-6361/202555082 | |
| Published online | 09 December 2025 | |
Pushing JWST to the extremes: Search and scrutiny of bright galaxy candidates at z ≃ 15–30
1
INAF – OAR, Via Frascati 33, 00078 Monte Porzio Catone, (Roma), Italy
2
Dipartimento di Fisica, Sapienza, Università di Roma, Piazzale Aldo Moro 5, 00185 Roma, Italy
3
Centro de Astrobiología (CAB), CSIC–INTA, Cra. de Ajalvir km. 4, E28850 Torrejón de Ardoz, Madrid, Spain
4
University of Massachusetts, 710 N. Pleasant St, LGRB-520, Amherst, MA 01003, USA
5
NSF’s NOIRLab, Tucson, AZ 85719, USA
6
Department of Astronomy, The University of Texas at Austin, Austin, TX, USA
7
Department of Physics and Astronomy, University of California, Los Angeles, 430 Portola Plaza, Los Angeles, CA 90095, USA
8
Instituto de Astrofísica de Andalucía (CSIC), Apartado 3004, 18080 Granada, Spain
9
Astrophysics Science Division, NASA Goddard Space Flight Center, 8800 Greenbelt Rd, Greenbelt, MD 20771, USA
10
Dipartimento di Fisica, Università degli Studi di Milano, Via Celoria 16, I-20133 Milano, Italy
11
INAF – OAS, Osservatorio di Astrofisica e Scienza dello Spazio di Bologna, Via Gobetti 93/3, I-40129 Bologna, Italy
12
INAF-Osservatorio Astronomico di Padova, Via dell’Osservatorio 5, 35122 Padova, Italy
13
CEA, IRFU, DAp, AIM, Université Paris-Saclay, Université Paris Cité, Sorbonne Paris Cité, CNRS, 91191 Gif-sur-Yvette, France
14
Kapteyn Astronomical Institute, University of Groningen, PO Box 800 9700 AV Groningen, The Netherlands
15
Racah Institute of Physics, The Hebrew University of Jerusalem, Jerusalem 91904, Israel
16
Scuola Normale Superiore, Piazza dei Cavalieri 7, 56126 Pisa, Italy
17
Dipartimento di Fisica e Astronomia “G. Galilei”, Università di Padova, Via Marzolo 8, 35131 Padova, Italy
18
INAF – IASF Milano, Via A. Corti 12, I-20133 Milano, Italy
19
Università di Napoli “Federico II”, C.U. Monte Sant’Angelo, Via Cinthia, 80126 Napoli, Italy
20
Space Telescope Science Institute, Baltimore, MD, USA
21
University of Louisville, Department of Physics and Astronomy, 102 Natural Science Building, 40292 KY, Louisville, USA
22
School of Physics, The University of Melbourne, Parkville, VIC 3010, Australia
23
IPAC, California Institute of Technology, MC 314-6, 1200 East California Boulevard, Pasadena, CA 91125, USA
24
Centre for Astrophysics and Supercomputing, Swinburne University of Technology, PO Box 218 Hawthorn, VIC 3122, Australia
25
Center for Astrophysics, Harvard & Smithsonian, 60 Garden St, Cambridge, MA 02138, USA
26
Department of Physics & Astronomy, University College London, Gower St., London WC1E 6BT, UK
27
Dipartimento di Fisica e Scienze della Terra, Università degli Studi di Ferrara, Via Saragat 1, I-44122 Ferrara, Italy
28
Center for Computational Astrophysics, Flatiron Institute, 162 5th Avenue, New York, NY 10010, USA
29
ARC Centre of Excellence for All Sky Astrophysics in 3 Dimensions (ASTRO 3D), Australia
30
Como Lake Center for Astrophysics, DiSAT, Università degli Studi dell’Insubria, Via Valleggio 11, I-22100 Como, Italy
31
School of Astronomy and Space Science, University of Chinese Academy of Sciences (UCAS), Beijing 100049, China
32
National Astronomical Observatories, Chinese Academy of Sciences, Beijing 100101, China
33
Institute for Frontiers in Astronomy and Astrophysics, Beijing Normal University, Beijing 102206, China
34
Laboratory for Multiwavelength Astrophysics, School of Physics and Astronomy, Rochester Institute of Technology, 84 Lomb Memorial Drive, Rochester, NY 14623, USA
⋆ Corresponding author: This email address is being protected from spambots. You need JavaScript enabled to view it.
Received:
8
April
2025
Accepted:
20
October
2025
Abstract
Aims. We investigate the galaxy ultraviolet luminosity function (UV LF) at z ≃ 15 − 30 to constrain early galaxy formation scenarios aimed at explaining the mild evolution of the UV LF bright end reported by JWST at z ≈ 10 − 15.
Methods. We designed customised Lyman-break colour selection techniques to identify galaxy candidates in the redshift ranges 15 ≤ z ≤ 20 and 20 ≤ z ≤ 28. The selection was performed on the ASTRODEEP-JWST multi-band catalogues of the CEERS, Abell-2744, JADES, NGDEEP, and PRIMER survey fields, covering a total area of ∼0.2 sq. deg.
Results. We identified five candidates at 15 ≤ z ≤ 20, whereas no objects were found based on the z ≳ 20 colour selection criteria. Despite exhibiting a > 1.5 mag break, all the objects display multi-modal redshift probability distributions across different SED-fitting codes and methodologies. The alternative solutions correspond to poorly understood populations of low-mass quiescent or dusty galaxies at z ∼ 3 − 7. This conclusion is supported by the analysis of five F200W dropout objects that we found to be interlopers based on NIRSpec PRISM spectra: four dusty star-forming galaxies at z ∼ 2.2 − 6.6 and a passive galaxy at z = 4.91, with log(Mstar/M⊙)≲9. We measured the UV LF under different assumptions on the contamination level within our sample. We find that if even a fraction of the candidates were indeed found at z ≳ 15, the resulting UV LF would point to a very mild evolution compared to estimates at z < 15, implying a significant tension with existing theoretical models. In particular, confirming our bright (MUV < −21) candidates would require substantial revisions to the theoretical framework. In turn, if all these candidates ended up being confirmed as interlopers, we would have to conclude that future surveys might require ten times wider areas to be able to select MUV ≲ −20 galaxies at z > 15. Observations in the F150W and F200W filters at depths comparable to those in the NIRCam LW bands would also be required to mitigate contamination from rare red objects at z ≲ 8.
Key words: galaxies: high-redshift / galaxies: luminosity function / mass function / dark ages / reionization / first stars
© The Authors 2025
 Open Access article, published by EDP Sciences, under the terms of the Creative Commons Attribution License (https://creativecommons.org/licenses/by/4.0), which permits unrestricted use, distribution, and reproduction in any medium, provided the original work is properly cited.
This article is published in open access under the Subscribe to Open model. This email address is being protected from spambots. You need JavaScript enabled to view it. to support open access publication.
1. Introduction
Since the beginning of its operations, JWST has enabled the detection of galaxies beyond z ∼ 10, breaking the redshift barrier that was the consequence of the limited infrared (IR) sensitivity of HST, Spitzer, and ground-based telescopes. Several bright galaxies (in fact, more than we expected to find based on the observed evolution at z = 5 − 9 or from theoretical models) were quickly detected by the very first Early Release Science observations (e.g. Naidu et al. 2022a; Castellano et al. 2022; Finkelstein et al. 2022). This result was later statistically corroborated by wider-area surveys (e.g. Harikane et al. 2023; Castellano et al. 2023; McLeod et al. 2024; Donnan et al. 2024) and using spectroscopically confirmed samples (Harikane et al. 2024; Napolitano et al. 2025a). In fact, spectroscopic confirmations and characterisations have been shown to be extremely efficient at z ∼ 10 − 12 (e.g. Arrabal Haro et al. 2023a,b; Roberts-Borsani et al. 2024, 2025a; Castellano et al. 2024; Napolitano et al. 2025b) and up to z ∼ 14 (Carniani et al. 2024, 2025; Naidu et al. 2025).
This situation stands in stark contrast with the poor constraints available at z > 14.5. Despite the fact that the UV rest frame emission is, in principle, within the NIRCam spectral coverage up to z ∼ 30, attempts to identify galaxies at z > 15 in existing surveys have led to very few candidates (Yan et al. 2023a,b; Leung et al. 2023; Austin et al. 2023; Conselice et al. 2025; Robertson et al. 2024; Kokorev et al. 2025; Whitler et al. 2025; Gandolfi et al. 2025; Pérez-González et al. 2025a) and none of them have been confirmed spectroscopically. The most striking example is object CEERS-93316, which appeared to be a strong z ∼ 16 candidate based on CEERS imaging data (Donnan et al. 2023; Harikane et al. 2023). However, this eventually proved to be a red galaxy at z = 4.9 whose photometry appears consistent with a z = 16.2 Lyman-break galaxy due to a very unfortunate combination of a red continuum with extremely strong rest-optical line emission (Arrabal Haro et al. 2023b).
From an observational point of view, several effects conspire to make selection at z ≳ 15 more difficult. On the one hand, objects become fainter and are detected in a smaller number of photometric bands, making the detection of spectral breaks and the constraints on the UV continuum less significant. On the other hand, the contamination in photometric samples is expected to increase with redshift, as true sources become rarer relative to potential contaminants (Vulcani et al. 2017), and this trend may be worsened by new classes of poorly characterised low-and-intermediate-redshift objects entering the selection criteria (Zavala et al. 2023; Pérez-González et al. 2023a, 2024a; Glazebrook et al. 2023; Bisigello et al. 2023, 2025; Rodighiero et al. 2023; Gandolfi et al. 2025).
Breaking the z ∼ 15 barrier is fundamental for testing theoretical models of galaxy evolution and for approaching the epoch of formation of the first stars and first black holes. In fact, the different explanations that have been invoked to explain the mild evolution of the UV LF at z ≳ 10 differ in their predictions at earliest times (Kokorev et al. 2025; Pérez-González et al. 2025a). For instance, sustained high luminosity density beyond z = 15 is favoured by changes in the initial mass function (IMF) or by an increased star formation efficiency (SFE, e.g. Dekel et al. 2023; Trinca et al. 2024; Hutter et al. 2025; Mauerhofer et al. 2025), as well as by a rapid assembly of baryons (Haslbauer et al. 2022; McGaugh et al. 2024). Meanwhile, the prediction of an earlier phase of dust-enshrouded star formation (e.g. Ferrara et al. 2023; Ziparo et al. 2023) or alternative dark energy or dark matter scenarios (Menci et al. 2024; Gandolfi et al. 2022) would result in a sharp decline, along with the redshift of the luminosity density.
In this paper, we analyse the ASTRODEEP-JWST photometric sample (Merlin et al. 2024, M24 hereafter), which provides consistent measurements on the major JWST deep surveys, to select bright galaxy candidates at z ∼ 15 − 30. We briefly present the dataset in Sect. 2. In Sect. 3 we describe our specific renditions of the Lyman-break technique and the results of our search for galaxy samples at 15 ≤ z ≤ 20 and 20 ≤ z ≤ 28. We investigate a number of alternative low-redshift solutions for our candidates in detail, along with the spectroscopic properties of five confirmed interlopers at z ∼ 2 − 7 in Sect. 4. The implications on the evolution of the UV LF and a comparison with theoretical models are presented in Sect. 5, while Sect. 6 explores the lessons learned from our analysis for designing future observations of galaxies at z > 15. The results are summarised in Sect. 7. Throughout the paper, we adopt AB magnitudes (Oke & Gunn 1983), a Chabrier (2003) initial mass function (IMF) in the range 0.1−100 M⊙, the Calzetti et al. (2000) attenuation law, and a flat ΛCDM concordance model (H0 = 70.0 km s−1 Mpc−1, ΩM = 0.30).
2. Observations and data analysis
We used JWST and HST photometric measurements from the ASTRODEEP-JWST catalogues presented in M24. We analysed the seven surveys comprising the public catalogue release1: CEERS (ERS 1345, P.I. Finkelstein, Finkelstein et al. 2025); the JADES-GS (data release v2.0) and JADES-GN (v1.0) fields on the GOODS-South and GOODS-North footprints, respectively (GTO 1180 and GTO 1210, P.I. Eisenstein, Eisenstein et al. 2023), including FRESCO data (GO 1895, P.I. Oesch, Oesch et al. 2023); the first-epoch imaging of the NGDEEP field (Co-PIs Finkelstein, Papovich, Pirzkal, Bagley et al. 2024); the PRIMER (GO-1837, P.I. Dunlop) observations of the UDS and COSMOS fields in CANDELS (Grogin et al. 2011; Koekemoer et al. 2011); the A2744 field including JWST observations from GLASS-JWST (ERS 1324, P.I. Treu, Treu et al. 2022), UNCOVER (GO 2561, P.I. Labbé, Bezanson et al. 2024), DDT 2756 (P.I. Chen), and GO 3990 (P.I. Morishita, Morishita et al. 2025). The considered observations cover a significant range in both area and depth, from relatively wide surveys as PRIMER-UDS (∼250 sq. arcmin, 50% completeness at mag50 ∼ 28.8 in the detection band), to deep pencil-beam pointings such as NGDEEP (∼9.5 sq. arcmin, mag50 ∼ 30.8) and the lensed field A2744 (∼46 sq. arcmin, mag50 ∼ 29.7). We refer to M24 for details on the survey properties and photometric techniques. Briefly, sources in all fields were detected with SEXTRACTOR (Bertin & Arnouts 1996) on a weighted average of the NIRCam F356W and F444W images, which is also used to measure total fluxes in Kron (1980) apertures using A-PHOT (Merlin et al. 2019). Fluxes in the other bands were measured by scaling the aforementioned total flux according to the colours measured within optimal apertures on PSF-matched images (see also Merlin et al. 2022; Paris et al. 2023). In the present paper, we use total fluxes based on the optimal apertures as defined by M24, the signal-to-noise ratios (S/Ns) are evaluated at twice times the PSF full width at half maximum (FWHM) for each band. The seven fields comprise a total of 531173 objects in an area of ∼615 sq. arcmin, making the ASTRODEEP-JWST the largest publicly released JWST catalogues available to date. The available imaging datasets are slightly different in the various fields. In particular, JWST NIRCam F090W is missing or was not public at the time of the catalog, in the CEERS, NGDEEP and over most of the A2744 area, while the medium band F410M filter is not available in NGDEEP and in the GLASS-JWST observations of A2744. Most importantly, as discussed in M24, the HST coverage is even less uniform both in terms of depth and number of available filters. For the present work, we built the weighted average stacks of all the ACS and WFC3 HST bands available in each field, respectively. The S/N of all ASTRODEEP-JWST sources was measured within an aperture with a diameter of twice the PSF FWHM on both the HST stacks and used (as described in the following section) to constrain non-detection bluewards of the Lyman-break.
3. Lyman-break selection at z ≃ 15–30
Here, we describe the approach we used to select high-z candidates, which is a modified version of Lyman-break colour selection criteria (Giavalisco 2002). The selected objects were then inspected through a full photometric redshift analysis to investigate their reliability.
3.1. Colour selection criteria
We defined the colour selection criteria for galaxies in two different redshift ranges, z ∼ 15 − 20 and z ∼ 20 − 30, on the basis of mock catalogues of objects at z = 0 − 30 tailored to match the noise properties of our observations, as previously done for the z ∼ 9 − 15 range by Castellano et al. (2022). In particular, we used two different simulations. The first simulation is based on a catalogue comprising objects at 0 < z ≤ 5 over an area of ∼0.12 sq. deg. generated with the Empirical Galaxy Generator (EGG) code (Schreiber et al. 2017), which exploits empirical relations to reproduce the observed number counts and colour distributions of galaxies at low and intermediate redshifts, including quiescent and dusty populations. The second simulation is based on the mock catalogues from the JAdes extraGalactic Ultradeep Artificial Realizations (JAGUAR, Williams et al. 2018), including predicted NIRCam fluxes for objects at 0.2 < z < 15 and stellar mass log(M/M⊙) > 6 over an area of ∼0.34 sq. deg. JAGUAR provides a complementary test with respect to EGG also thanks to the inclusion of emission lines in the predicted SEDs. We added sources at z > 5 (z > 15) to the EGG (JAGUAR) simulation following the evolving UV LF at z ∼ 5 − 10 (Bouwens et al. 2021), assuming no evolution beyond z = 10 and artificially boosting the number counts at z > 10 by a factor of 20 in order to provide sufficient statistics to design appropriate selection criteria. These high-redshift galaxies were generated by randomly associating to each object a template from a library based on Bruzual & Charlot (2003, BC03 hereafter) models with metallicities 0.02 or 0.2 Z⊙, 0 < E(B − V) < 0.2 and a constant star formation history (SFH) to predict the relevant photometry. The over-representation of high-redshift sources in the mock catalogues is taken into account by consistently scaling the relevant number counts when evaluating the selection criteria in terms of purity and completeness. Finally, we assessed the potential contamination by late-type dwarf stars using synthetic JWST photometry for the models by Marley et al. (2021) which include brown dwarfs and self-luminous extrasolar planets with 200 ≤ Teff ≤ 2400 and metallicity [M/H] from 0.5 to +0.5. The brown dwarf models were normalised at 26.0 ≤ F444W ≤ 28.0 in 0.5 mag steps. All the catalogues were perturbed by adding noise in order to reproduce the expected relation and scatter between magnitudes and errors in each band and in each of the analysed fields.
After extensive testing, we first defined a detection threshold corresponding to S/N > 10 in the detection band used by M24 (i.e. F356W+F444W). We also defined the following selection criteria to identify objects at z ∼ 15 − 20, minimising contamination from low-redshift sources,
 (1)
(1)
We require a S/N < 2.0 in the F090W (where available), F115W, and F150W bands, as well as in both the ACS and WFC3 stack, with at most one of these bands bluewards of the break having S/N > 1.5. To limit our sample to objects with continuous coverage redwards of the Lyman break and to avoid spurious, single-band detections, we also required S/N > 2 in each of the F277W, F356W, and F444W bands. All the adopted S/Ns are measured in 2 × FWHM apertures.
Similarly, we find that objects at z ∼ 20 − 28 are well identified by the following selection criteria, as shown in the bottom panel of Figure 1,
 (2)
(2)
As above, we require S/N > 2 in the bands redwards of the Lyman break (F356W, F444W), S/N < 2.0 bluewards of the break (stacked ACS and WFC3 images, F090W, F115W, F150W, and F200W bands), with at most one band bluewards of the break having S/N > 1.5.
When analysing the observed dataset (Sect. 3.2), we also excluded objects classified as spurious by M24 or following a visual inspection, such as hot pixels and stellar spikes. We find that the proposed diagrams efficiently select high-redshift targets up to z ∼ 28, where the F356W–F444W colour becomes ≳0.5 due to the Lyman-break entering the F356W band. Some contamination from low-redshift galaxies is evident from the redshift distribution of the selected objects (see right panels in Fig. 1). We found a contamination rate of < 0.05 objects/arcmin2 in the EGG-based simulations, < 0.01 objects/arcmin2 in the JAGUAR-based simulation for the z ∼ 15 − 20 selection, and < 0.01 arcmin−2 in both simulations for the z ≳ 20 selection. We did not find any contamination by late-type dwarf stars in any of the proposed selection criteria, consistently with their expected colours and the detectable emission at λobs ∼ 1 μm (Holwerda et al. 2018, 2024).
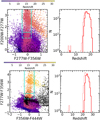 |
Fig. 1. Colour selection diagrams (left panels) for the selection of galaxies at z ∼ 15 − 20 (top) and z ∼ 20 − 30 (bottom). The cyan solid lines enclose the regions in which the reference sample to estimate the LFs are selected. The cyan dashed lines enclose regions where the additional extended samples are selected. The relevant redshift distributions of the selected reference (extended) samples are shown in the right panels as continuous (dashed) histograms. The points colour-coded according to the relevant redshift show objects from a mock generated over an area of 0.12 sq. deg., with low-redshift populations generated through the EGG software (Schreiber et al. 2017). Black stars show the position of brown dwarf models from Marley et al. (2021). All fluxes were perturbed with realistic noise properties to reproduce the typical depth of the JADES-GS field. Similar diagrams have been analysed for all fields using both the EGG- and JAGUAR-based simulations described in Sect. 1. |
Our baseline selection criteria are meant to isolate a reference sample that would then be adopted to estimate the UV LF. In addition, we find that by lowering the colour thresholds we can select additional very high-redshift targets, although with a significantly higher contamination rate (≳0.1/arcmin−2). An additional extended sample of targets with (F200W − F277W) > 1.0 (z ∼ 15 − 20) and (F277W − F356W) > 0.8 (z ≳ 20) has been selected for potential follow-up and to characterise the properties of interloper populations in Sect. 4.2.
3.2. Selected sources over ∼0.2 deg2
Our baseline F200W dropout criteria for z ∼ 15 − 20 yields a total of 12 objects. Among them (and consistently with previous works), we re-selected the strong line-emitter object CEERS-93316 (ID = 84213 in M24) with zspec = 4.9 as a z ∼ 16 candidate (Arrabal Haro et al. 2023b). We also find that the only candidate selected in the A2744 field (ID = 27713 in M24) is a transient source. In fact, object A2744_27713 was not detectable in the first epoch observations (June 2022) of the GLASS-JWST NIRCam parallel, but it is clearly detected in all LW bands from the second epoch dataset observed in November 2022. This object, whose redshift remains undetermined, masquerades as a F200W dropout because it falls in the chip gap of NIRCam SW second-epoch observations.
After excluding these two interlopers, we were left with an initial sample of ten F200W dropouts. Of these, five candidates (one in UDS, one in CEERS, and three in COSMOS) were recently observed with NIRSpec PRISM by the CAPERS survey (GO-6368, P.I. M. Dickinson), finding that they are interlopers with a spectroscopic redshift in the range zspec ∼ 2 − 7, as discussed in more detail in Sect. 4.3.
The final reference sample of F200W dropout candidates that we discuss in this paper is therefore made of five sources: three candidates in PRIMER-COSMOS, one in CEERS, one in JADES-GN, and no sources selected in both JADES-GS and NGDEEP. As described above, neither A2744 nor PRIMER-UDS, which is the widest and shallowest among the considered fields, contribute to the final sample as the two selected sources are confirmed interlopers. Interestingly, candidates in COSMOS are close on the sky plane, thereby confirming their high-redshift nature, would be at ∼1−5 physical Mpc distance from each other, possibly implying that they are part of distant overdensities. In addition, we selected 26 F200W-dropout objects meeting the less conservative colour thresholds described in Sect. 3 (extended sample).
We did not find any object meeting our reference F277W-dropout criteria, while 19 sources are included in the relevant extended sample. We show in Fig. 2 the position of all our candidates in the observed colour-colour diagrams. The IDs and main properties of objects in our reference F200W dropout sample are presented in Table 1, while their SED and NIRCam thumbnails are shown in Fig. 3. The SEDs and main properties of the objects in the extended samples are presented in the Appendix A.
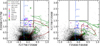 |
Fig. 2. Observed colour selection diagrams for LBGs at z ∼ 15 − 20 (left) and z ∼ 20 − 30 (right). The black continuous lines enclose the region, where ‘reference’ samples are selected. Large, filled markers show the position of the objects selected from the various fields, while the seven selected interlopers are shown as open symbols: CEERS-93316 (Arrabal Haro et al. 2023b), the transient A2744_27713, and the five objects observed with NIRSpec PRISM by the CAPERS survey (Sect. 4.3). Small markers show the position of candidates in the ‘extended’ samples selected within the colour region enclosed by dashed lines. Objects detected at S/N > 10 at any redshift in the JADES-GS field are shown as black points to highlight the parameter space where the bulk of ASTRODEEP-JWST objects are found. The coloured tracks mark the expected colours of stellar plus nebular BC03 templates at the different redshifts indicated by the relevant labels: high-redshift star-forming galaxies at z ≥ 10 with an age = 20 Myr, Z = 0.02 Z⊙, and E(B − V) = 0 (blue); passively evolving galaxies at 0 ≤ z ≤ 10 with Z = 0.2 Z⊙ formed with an instantaneous burst at z = 15 (dark red); dusty objects at 0 ≤ z ≤ 10 with an age = 100 Myr, Z = 0.2 Z⊙, and E(B − V) = 0.8 (dark green). |
F200W dropout candidates in the ASTRODEEP-JWST fields.
We performed additional checks on the reliability of the five objects in the reference sample of F200W-dropout sources. First of all, we measured the S/N within an aperture of twice the PSF FWHM on a stack of the NIRCam F090W, F115W, and F150W bands available for each of them, finding that they are all non-detected at S/N < 2. We then computed the S/N on the NIRCam F090W, F115W, and F150W bands in two other apertures measured by M24; namely, an aperture with a radius of 0.1 arcsec (R01) and the one with a diameter of three times the PSF-FWHM. All objects are non-detected in these bands at S/N < 2 in all cases.
We then searched for MIRI imaging observations at the position of our candidates. The three COSMOS sources are covered by observations by the PRIMER and COSMOS-3D (GO-5893, PI K. Kakiichi) programmes, while CEERS_17384 has been observed by the MIRI EGS Galaxy and AGN survey (MEGA; GO-3794, PI A. Kirkpatrick). We reduced the MIRI imaging datasets in all fields using the Rainbow JWST pipeline as described in Pérez-González et al. (2024b), and measured the S/N at the position of the candidates on the final mosaics in apertures with a radius of 0.3 (F770W), 0.4 (F1000W), and 0.6 arcsec (F1500W, F1800W, F2100W). We find non-detections in all analysed images for COSMOS_84213 (F770W > 26.4, F1800W > 23.4, at 2σ), COSMOS_118438 (F770W > 26.2, F1800W > 23.5), and COSMOS_107923 (F770W > 26.3, F1000W > 24.8). CEERS_17384 is undetected in the F1000W (> 25.3), F1500W (> 24.5), and F2100W (> 23) bands, but shows a ∼3σ detection in the F770W one (26.6 ± 0.3 AB), which we consider as tentative, because of potential contamination by two bright sources in its vicinity. Finally, we used the DAWN JWST Archive (DJA)2.
We estimated the MUV of the five candidates by converting to the rest-frame the observed F277W magnitude assuming a redshift of z = 18, where our redshift selection function peaks, and their UV slope, β, by fitting the F277W, F356W, and F444W bands. We found two candidates brighter than MUV ∼ −21, with the brightest object in the sample COSMOS_107923 having MUV ∼ −22.7. Three of the objects have a red β > −2, the remaining ones being consistent with a flat or moderately blue UV slope (β ≲ −2). We measured their half-light radius by fitting the light distribution in the F277W band with GALIGHT (Ding et al. 2020; Birrer et al. 2021), assuming a Sersic (1968) profile with free index n and fixing the redshift at the best-fit solution at z > 10. We found half-light radii consistent with those of observed in galaxies at z ∼ 10 − 15 (Westcott et al. 2025; Ono et al. 2025). Our candidates have a typical half-light radius of ≃0.2−0.3 kpc.
We compared our samples with z ≳ 15 samples selected by other groups in the fields analysed here. Our F200W-dropout candidate in CEERS is not included in the sample of very red sources by Gandolfi et al. (2025), while four of their five objects potentially at z > 15 do indeed have colours that are compatible with our selection window, but have not been included here because of S/N < 10 in the detection band; in one case (their A-22691), a marginal (S/N ∼ 2.2) detection in the ACS stacked image. The remaining source (U-53105) has not been detected in the M24 catalogue. Object NGD-z15a/NGDEEP-1369 was presented as a z ∼ 15.6 candidate by both Austin et al. (2023) and Leung et al. (2023). It was also matched to object ID = 1301 in M24. It has colours consistent with our inclusive selection window but is not part of our extended sample because of a detection at S/N ∼ 2.5 in the stack of the ACS bands. Five of the sources selected by Pérez-González et al. (2025a) in the MIDIS+NGDEEP observations, including the z ∼ 19.6 candidate MDS025593 by Pérez-González et al. (2023b), are not covered by the first-epoch NGDEEP imaging used by M24, the remaining ones being non-detected except their MIDIS-z17-7 (ID = 8412 in M24), which is at S/N ∼ 4 (i.e. well below our S/N = 10 threshold). The z ≳ 15 sources selected by Hainline et al. (2024) in the JADES fields with a counterpart in M24 do not fall within our colour selection window and they are detected at S/N < 10 except their JADES-GS-53.12692-27.79102 (ID = 51718 in M24). Finally, the z ∼ 15 candidate JADES-GN+189.16733+62.31026 by Whitler et al. (2025) (ID = 56718 in M24) was not selected due to its (F200W − F277W) ∼ 0.9; namely, it is slightly below the threshold to enter our extended sample presented in Appendix A.
4. A closer scrutiny of the selected candidates
In this section, we analyse the selected candidates in more detail to assess their reliability and evaluate the possibility that their peculiar colours are instead indicative of rare lower redshift interloper populations. Although we focus here on the five candidates, we remark that very similar arguments can be made for the five sources that have been confirmed as interlopers, as discussed in Sect. 4.3.
4.1. The photometric redshift probability distribution
Following a well-established practice, we have derived the photometric redshift of our candidates analysing their multi-wavelength photometry with a set of standard SED fitting tools. To alleviate the impact of specific flavours of the adopted techniques and to broaden the range of spectral libraries explored, we exploited four different codes: ZPHOT (Fontana et al. 2000), EAZY (Brammer et al. 2008), BAGPIPES (Carnall et al. 2018, 2019), and CIGALE (Boquien et al. 2019). Rather than focusing on the best-fitting photometric redshift, we have used all these codes to compute the redshift probability distribution (P(z)). This distribution encapsulates the full information on the different potential solutions for an object with given photometry.
In summary, we ran ZPHOT adopting a set of synthetic models drawn from the BC03 library with a range of metallicities from 0.02 Z⊙ to 2.5 Z⊙, 0 ≤ E(B − V)≤1.1, and with a delayed (ϕ ∝ t2e−t/τ) SFH (see Santini et al. 2023, and M24). The nebular emission was self–consistently included following Schaerer & de Barros (2009) (see also Castellano et al. 2014), based on the template luminosity at ionising frequencies. We analysed our candidates with EAZY in two different ways as described in M24, using: (1) only its standard set of semi-empirical templates and (2) the recent set of templates from Larson et al. (2023), which are designed explicitly to reproduce the colours of high-redshift galaxies. The BAGPIPES runs exploited the BPASS v. 2.2.1 stellar models with an upper-mass cutoff of the IMF of 300 M⊙ (Stanway & Eldridge 2018), while the nebular emission was computed self-consistently with CLOUDY (Ferland et al. 2013), as described by Carnall et al. (2018). Following Gandolfi et al. (2025), we increased the number of live points (i.e. the walkers used by BAGPIPES in the Markov chain Monte Carlo sampling) from the default 400 to 2000 to enhance sensitivity to strong line emitter solutions and allowed the ionisation parameter to reach log U = −1. We assumed three different SFHs: delayed, double power law, and exponential SFH. Finally, we run CIGALE in two configurations. In the first case, we assumed a SFH with a delayed component of age between 100 Myr and the age of the universe at each redshift, plus a constant burst of 10 Myr duration. The fraction of stellar mass formed in the recent burst is allowed to vary between 0 and 50% of the total assembled mass. We used BC03 templates including nebular emission, metallicity 0.02, 0.2, 1 Z⊙, and V-band extinction 0 ≤ AV ≤ 5. The second CIGALE configuration exploits star formation plus AGN templates where the stellar component is parametrised as described above and the AGN emission is based on the DALE2014 module (Dale et al. 2014). The AGN fraction (fAGN), defined as the ratio of AGN luminosity to the total AGN and dust luminosities, is set as a free parameter. To summarise, from the combination of codes and assumptions adopted, we have obtained eight different P(z) for all our candidates. The P(z) of the five objects in our reference sample of F200W dropout candidates are shown in the upper panels of Fig. 3. We show in Fig. 4, the average P(z) for the extended samples of F200W- and F277W-dropout candidates.
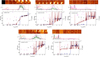 |
Fig. 3. Spectral energy distributions, P(z) and NIRCam thumbnails of the five F200W dropout candidates. For each object the best-fit templates at high and low redshift from the ZPHOT run are shown in blue and red, respectively. The relevant predicted magnitudes are indicated by blue empty squares and red empty hexagons, respectively. The photometric measurements are from M24, with black (magenta) circles and error-bars indicating JWST (HST) bands. The 2σ upper limits are shown as triangles. The P(z) from ZPHOT are shown as orange lines, the ones from EAZY adopting standard (standard plus Larson) templates are shown as continuous (dashed) light blue lines, the P(z) from BAGPIPES are shown in green with continuous, dashed and dotted lines respectively assuming a delayed, double power-law and exponential SFH, and the P(z) from CIGALE using a star-forming (star-forming+AGN) fit are shown as continuous (dashed) magenta lines. All curves are normalised to have P(z) = 1 at the peak. The 1.2 × 1.2 arcsec thumbnails, from left to right, respectively, show the objects in the F090W (where available), F115W, F150W, F200W, F277W, F356W, F410M, and F444W bands used for the ASTRODEEP-JWST measurements. |
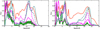 |
Fig. 4. Average redshift probability distribution functions, P(z), for objects in the extended samples of F200W dropouts (left) and F277W dropouts (right) computed with ZPHOT, EAZY, BAGPIPES, and CIGALE (same colour conventions as in Fig. 3). The curves are normalised to have P(z) = 1 at the peak. |
Although there are specific differences among the various objects and the different codes, a number of general conclusions can be drawn from this analysis. First, it is clear that all objects exhibit a z > 15 solution, consistent with the colour selection criteria adopted. The inferred redshifts tend to be reasonably similar among the codes, as the main spectral feature determining the high-redshift solution is the Lyman-break (coupled with the shape of the star–forming continuum immediately redwards) that is essentially common in all recipes. However, all our candidates also reveal a lower redshift solution in all the runs analysed here. The low-redshift solutions are typically peaked at z = 3 − 7, suggesting that the strong observed break in the F200W band can also be ascribed to a break around the Balmer break and 4000 Å rest-frame region, as we describe in detail in the following. In several cases, z ≲ 2 solutions are also viable and generally preferred by BAGPIPES. A detailed inspection shows that this is generally due to a peculiar combination of strong emission lines that may conspire to reproduce the observed colours. We remark that given the resulting P(z), none of our candidates would pass a selection criterion such as Δχ2 > 4 between different redshift solutions that has been often adopted to build LFs at z > 9 (e.g. Finkelstein et al. 2024; Harikane et al. 2023). Unfortunately, our candidates are simply too faint and their photometry is built on a too small number of photometric bands with solid detections to be unambiguously selected in the same manner. It is also clear that while they overall provide a consistent picture of double peaked solutions, there are significant differences between the adopted codes, both in terms of the breadth of the low-redshift solution and of the relative weight between the low- and high-redshift peaks. These differences arise from the different libraries adopted and probably from slight differences in the fitting procedure. This picture is confirmed by the average P(z) of the extended samples of F200W- and F277W-dropout candidates (Fig. 4).
We note that P(z) also depends crucially on the details of the adopted photometry. Clearly, but somewhat counterintuitively, the additional information provided by the HST photometry decreases the constraining power of P(z). Because of the faintness of our candidates, in fact, the HST upper limits are easily satisfied by a wide class of solutions at low redshifts, eventually adding little contribution to the global χ2, while increasing the number of degrees of freedom, n, and hence increasing the probability at low redshifts. These results are based on the ASTRODEEP-JWST catalogues, which provide homogeneous photometric measurements for all sources. We find that the MIRI constraints discussed in Sect. 3.2 do not significantly change the scenario described above. The P(z) maintain the same double-peaked nature with both high- and low-redshift solutions when including the MIRI upper limits, and, in the case of CEERS_17384, the tentative F770W detection. In fact, the MIRI non-detections are poorly constraining for all our sources, with the exception of COSMOS_107923 for which the limit in the F770W increases the probability of passive solutions with respect to dusty star-forming ones in the low-redshift peak. In fact, the MIRI imaging should be 1−2 mag deeper in the F770W and F1000W bands, and > 3−4 mag deeper at λobs > 15 μm to yield meaningful constraints for the other candidates. Finally, when including additional NIRCam medium-band photometry for JADES-GN_9538 we find an overall similar P(z) but with a slightly increased probability at z ∼ 13 − 15 due to the marginal detection in the F182M band.
We took from these results three main lessons. The first is that all our objects are, in principle, credible candidates at 15 < z < 20, but none of them are solid enough to be unambiguously assigned these extreme redshifts. In addition, the differences among the various P(z) suggest that a detailed and sophisticated analysis built on their shape should be taken with caution, as they may depend on subtle details in the photometric measurements and on the spectral libraries adopted. Finally, as we discuss below, the most important factor preventing a robust use of the P(z) in the selection process is our limited knowledge of the populations of faint, red interlopers.
4.2. The nature of potential interlopers
The photometric redshift distributions described above help us unveil the physical properties of the galaxies that may contaminate our selection criteria. Adopting for simplicity the results of the ZPHOT code, we have inspected the physical properties corresponding to the models that populate the low redshift peaks in the P(z). The best-fit SEDs at z < 10 of the F200W dropout candidates are shown in Fig. 3.
In the case of the candidate in CEERS, the low-redshift best-fit solution is a z ≃ 5 quiescent galaxy with a low specific star formation rate (sSFR) and large stellar age. The remaining sources, instead, are best reproduced by star-forming models with a very high sSFR and high dust attenuation, whose red continuum and strong emission lines yield colours that are compatible with our selection criteria.
These two kinds of solutions are representative of the general properties of galaxy templates that typically yield low-redshift solutions for our objects, as shown in Fig. 5. We compared the solutions that provide an acceptable fit with probability P(z) > 0.5 for the F200W-dropout candidates to the locus of objects in the same redshift range from the JADES-GS field. The statistically acceptable models populate regions that have a small overlap with the ones occupied by the bulk of sources in the same redshift range. Consistently with the SEDs shown in Fig. 3, the 2 < z < 8 templates cover a region in the sSFR versus E(B − V) plane that connects quiescent, low dust models (lower left corner) with highly star-forming, dusty (upper right corner) ones. Instead, the general distribution of galaxies in this plane shows that most of the objects tend to populate the region of intermediate sSFR and E(B − V). The E(B − V) vs Mstar plane shows that acceptable solutions include z ∼ 0 − 4 templates with a higher dust-extinction than typical sources in the same redshift range, and, in particular, are consistent with potential contamination of the F200W dropout selection by very low-mass, dusty galaxies, as previously noted by Bisigello et al. (2023) and Gandolfi et al. (2025).
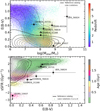 |
Fig. 5. Top: Position in the E(B − V) vs Mstar plane of galaxy templates (points colour-coded according to the redshift) that provide an acceptable fit with probability P(z) > 0.5 to the F200W dropout candidates. The regions occupied by the 90% to 10%, at 10% steps, of the aforementioned templates are enclosed by dotted curves. The continuous curves enclose the regions occupied by the 90% to 10%, at 10% steps, of the objects in the same redshift range from the JADES-GS field. The black square and error-bars mark the positions of the confirmed interlopers. Bottom: Same as top panel for low-redshift solutions at 2 ≤ z ≤ 8 in the sSFR vs E(B − V) plane, colour-coded according to the stellar age. |
All these templates can reproduce the sharp break observed around λobs ∼ 2 μm in our objects. Because of the faintness of our candidates, the amplitude of the break (which is much larger in z > 15 galaxies) cannot be properly measured with the existing photometry, leaving room for the ambiguity between the two redshift solutions.
We remark, however, that these potential low-redshift solutions correspond to objects that would be extremely interesting to investigate. These models have stellar masses M* in the range 107 − 109 M⊙, sometimes even as low as 106 M⊙. As long as quiescent galaxies are concerned, only objects with stellar mass above 1010 M⊙ have been confirmed at z > 4 (Carnall et al. 2024; Glazebrook et al. 2024; Weibel et al. 2025a; Pérez-González et al. 2025b). The available estimates of the stellar mass function of quiescent galaxies do not extend to these low masses, especially at these redshifts (Santini et al. 2021). These sources may also host the low-mass SMBH that are fundamental to constrain early AGN-galaxy co-evolution (Pacucci et al. 2023).
Concerning dusty solutions, on the other hand, there is a general consensus that faint, low-mass galaxies at z > 2 are essentially dust-free according to the strong correlations between dust-extinction and stellar mass (McLure et al. 2018; Bouwens et al. 2020). If (even some of) these candidates are instead low-mass, dusty galaxies as suggested by one class of solutions, they would correspond to a phase in galaxy evolution that has not been widely investigated so far. Recently, Bisigello et al. (2025) has spectroscopically confirmed a low mass, dusty galaxy at z ≃ 5, suggesting that other similar objects (1−15% of the sources of similar mass and redshift) might be hidden in the photometric sample. Although rare, galaxies with rest-frame colours that approach our colour selection criteria do exist in nature. As a result, we cannot exclude the possibility that some (or even all) our candidates are indeed intermediate redshift interlopers.
We cannot exclude that contamination from an AGN is also present, although it seems less likely than from dusty or quiescent galaxies. In fact, when including AGN emission, CIGALE tends to increase rather than decrease the probability of z > 15 solutions, in some cases indicating them as best-fit. Finally, we do not expect significant contamination from little red dots (LRDs) at z ∼ 3 − 8, except possibly for the reddest objects with strong emission lines whose predicted colours are similar to those of dusty, high-sSFR galaxies (Killi et al. 2024; Pérez-González et al. 2024b).
4.3. The confirmed interlopers
Five of the ten objects originally selected as F200W-dropouts were recently observed with the NIRSpec PRISM in the framework of the CAPERS programme and found to be interlopers at z ∼ 2 − 7 (empty symbols in Fig. 2). We describe in the following their physical properties as inferred from the combination of NIRSpec spectroscopy (Fig. 6) and NIRCam photometry (Appendix B). These observations confirm that contaminants of our selection criteria are found in the populations presented in Sect. 4.2, namely dusty star-forming or quiescent galaxies with low stellar mass.
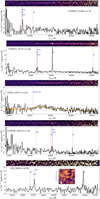 |
Fig. 6. Observed 2D (top) and 1D (bottom) NIRSpec PRISM spectra of the five interlopers observed by the CAPERS survey. Bottom panels: Noise RMS shown as the gray dashed line, while the red dashed lines highlight the wavelength of the detected features. The best-fit template obtained by fitting the CEERS_15937 spectrum with BAGPIPES is shown in yellow in the relevant panel. The inset in the UDS_56824 panel shows the 3 × 3 arcsec ALMA Band 7 map centred at the position of the object (black square), with the relevant beam size shown on the lower-left corner. |
The spectroscopic observations were carried out by adopting a NRSIRS2 readout pattern, standard three-shutter slits and a three-point nodding. The data were reduced with the STScI Calibration Pipeline3 version 1.13.4 as described in detail in Arrabal Haro et al. (2023a) (see also Castellano et al. 2024; Napolitano et al. 2025a). We determined the spectroscopic redshift from the weighted average centroid of the detected emission lines and measured line fluxes with a Gaussian fit after linearly extrapolating the continuum emission at the line position (see Napolitano et al. 2025a,b, for details).
4.3.1. COSMOS_31168 at zspec = 2.29
The spectrum of COSMOS_31168 (RA = 150.1809331 deg, Dec = 2.2607514 deg) shows one clear emission line at 1.64 μm, a lower significance emission feature at 2.15 μm, and a faint continuum. The most plausible redshift solution is zspec = 2.294, interpreting the aforementioned emission lines as the unresolved [O III]λ4959, 5007 doublet (with flux 9.7 ± 1.9 × 10⁻¹⁹ erg/s/cm2) and Hα ( = 3.1 ± 0.5 × 10⁻¹⁹ erg/s/cm2). The Hβ line is not detected, with a 2σ flux upper limit of 0.75 × 10⁻¹⁹ erg/s/cm2. The corresponding limit on the Balmer ratio results in E(B − V)≧0.32. We performed an SED-fitting of the object with ZPHOT by fixing the redshift at the spectroscopic value and adopting the aforementioned constraint on E(B − V), finding that the object is fitted as a low-mass (log ), low-SFR ( = 0.07
 M⊙ yr−1) dusty object.
4.3.2. COSMOS_35731 at zspec = 3.66
The CAPERS spectrum of this source (RA = 150.133574 deg, Dec = 2.2710158 deg) has prominent Hα (28.6 ± 0.2 × 10⁻¹⁹ erg/s/cm2), [O III]λ4959, 5007 (8.7 ± 0.2 × 10⁻¹⁹ erg/s/cm2) and Hβ (4.8 ± 0.2 × 10⁻¹⁹ erg/s/cm2) emission, yielding a robust spectroscopic redshift zspec = 3.657. The Balmer decrement implies a high extinction (E(B − V) = 0.6 ± 0.04), with a corrected SFR measured from the Hα luminosity of 1.9 ± 0.1 M⊙ yr−1. The SED fitting performed at fixed redshift and constraining E(B − V) within the 2σ range inferred from spectroscopy yields a stellar mass of only log .
.
4.3.3. CEERS_15937 at zspec = 4.91
The spectrum of CEERS_15937 (RA = 214.9442826 deg, Dec = 52.8358477 deg) shows continuum emission with a clear break at ∼2.15 μm. The shape of the continuum and the faint emission detectable down to ∼1 μm shows that the object is not at very high redshift. Due to the lack of evident emission features, we fitted the spectrum with BAGPIPES assuming a double power-law SFH, and leaving the redshift as a free parameter. We find that the object is fitted by a low-mass (log(Mstar/M⊙) = 8.9 ± 0.05) galaxy at  , with low extinction (E(B − V) < 0.02) and negligible SFR, corresponding to an upper limit of sSFR < −11.4 Gyr−1.
4.3.4. COSMOS_76919 at zspec = 5.18
This object (RA = 150.1845568 deg, Dec = 2.3535079 deg) is constrained to be at zspec = 5.182 from the detection of the Hα (2.2 ± 0.5 × 10⁻¹⁹ erg/s/cm2), [O III]λ4959, 5007 (4.8 ± 0.3 × 10⁻¹⁹ erg/s/cm2), and Hβ (0.4 ± 0.2 × 10⁻¹⁹ erg/s/cm2) lines. Similarly to COSMOS_31168 and COSMOS_35731, the object turns out to be a dusty (E(B − V) = 0.5 ± 0.3), low-mass (log(Mstar/M⊙) = 8.2 ± 0.4), and low SFR ( = 0.3 ± 0.1 M⊙ yr−1) object on the basis of the Balmer decrement, Hα luminosity, and constrained SED-fitting performed with ZPHOT.
4.3.5. UDS_56824 at zspec = 6.56
The spectrum of object UDS_56824 (RA = 34.454893 deg, Dec = −5.215586 deg) covers only the region at λobs > 3 μm, with a total integration time of 5690 s. The redshift can be accurately measured to be zspec = 6.56 ± 0.01 from the Hα, Hβ, [O III]λ4959, 5007 lines, which are clearly detected with fluxes FHα = 16.2 ± 2.1 × 10⁻¹⁹ erg/s/cm2, FHβ = 2.1 ± 0.9 × 10⁻¹⁹ erg/s/cm2, F[OIII]4959 = 2.1 ± 1.1 × 10⁻¹⁹ erg/s/cm2, and F[OIII]5007 = 1.26 ± 0.18 × 10⁻¹⁹ erg/s/cm2. The Balmer ratio implies a high dust attenuation with E(B − V) = 0.85 ± 0.46. Its [O III]λ5007/Hβ = 6.0 ± 2.7 puts the object in the star-forming region of the mass-excitation diagram (Juneau et al. 2014), although at the border with the AGN locus, such that a contribution from a dust-obscured active nucleus cannot be excluded. We checked the ALMA archive finding that the position of UDS_56824 has been observed by project #2015.1.01074.S (PI H. Inami) that we analyse as follows. We start from the calibrated measurement set and use the CASA tclean function to create a continuum map using the four 2 GHz-wide spectral windows, with an effective central frequency of ∼343 GHz (i.e. 870 μm). We apply natural weighting to the visibilities and test the effect of adding a uvtaper value to artificially increase the beam size. A ∼3σ detection is found at the NIRCam position of UDS_56824, with an integrated flux density of S870 μm = 0.54 ± 0.19 mJy (see Fig. 6).
The measured ALMA flux density was then combined with NIRCam photometry to perform an energy-balance SED fitting using BAGPIPES. During the fitting, the redshift was fixed to the spectroscopic value of z = 6.56, while the dust extinction, AV, was allowed to vary freely between 1.8 and 5, as constrained by the Balmer decrement. The best-fit stellar mass and SFR are log(Mstar/M⊙) = 9.8 ± 0.18 and SFR = 40 M⊙ yr−1, respectively, implying that UDS_56824 lies above recent estimates of the main sequence at 6 ≤ z ≤ 7 (Rinaldi et al. 2025; Cole et al. 2025). Additionally, we estimated the dust mass using standard relationships (e.g. Casey et al. 2019) and the following assumptions: κ450 μm = 0.13 m2 kg−1, Td = 25 K, and βdust = 1.8. This yields a dust mass of ∼5.5 × 10⁸ M⊙, close to 10% of the stellar mass, which is a remarkably high value given the redshift of the galaxy. Assuming a higher dust temperature of Td = 50 K would lower the dust-to-stellar mass ratio to log(Md/Mstar)∼ − 2.0, bringing it into better agreement with other high-redshift dusty galaxies (e.g. Ferrara et al. 2025a; Algera et al. 2024) and supporting a mild evolution towards higher dust temperatures at high redshifts (e.g. Mitsuhashi et al. 2024). Nevertheless, even in this scenario, this galaxy would stand out due to its high dust attenuation compared to UV-selected galaxies.
4.4. Critical assessment
These findings are consistent with our analysis in Sect. 4.2 indicating dusty star-forming galaxies and low-mass passive objects up to z ∼ 7 − 8 as a potential source of contamination of the F200W-dropout sample. However, it is apparent that a proper characterization of these interloper populations is extremely difficult and requires spectroscopic follow-up observations. In fact, CEERS_15937 is the only case for which the P(z) yielded an alternative solution in good agreement with the spectroscopic value (Fig. B.1). Instead, the redshifts of the other four objects do not match the primary, low-redshift peaks in our P(z), although the most likely alternative solutions are similarly dusty, star-forming objects whose broad-band fluxes are boosted by different combinations of emission lines.
Similarly to CEERS-93316 (Arrabal Haro et al. 2023b), the SEDs of COSMOS_31168, COSMOS_35731, COSMOS_76919 and UDS_56824 resemble that of z > 15 LBGs due to the combination of a red, attenuated continuum and line emission. Instead, CEERS_15937 enters the F200W-droput selection due to the well-known ambiguity between Lyman and Balmer break detection through broad-band photometry. Their position in the E(B − V) versus Mstar, and in the sSFR versus E(B − V) planes are in line with the expectations based on the P(z) (Fig. 5). The four dusty star-forming interlopers are significant outliers in the A1600 − Mstar relation (McLure et al. 2018), similarly to CEERS-93316 and CEERS-14821 (Bisigello et al. 2025). Object UDS_56824 appears to be an extreme case in terms of redshift and stellar mass compared to the locus of alternative solutions of the z > 15 candidates. The other known interlopers at z ∼ 2 − 5 are similar to UDS_56824 in terms of extinction and sSFR, but with a lower stellar mass log(Mstar/M⊙)≲9. In fact, UDS_56824 shows that even at z ∼ 6.5, some galaxies may be dominated by dust-obscured star formation (note that the uncorrected Hα-based SFR is ∼2−4 M⊙ yr−1). Finally, this ALMA-detected galaxy is fainter than all SCUBA-2-selected sources in UDS (Geach et al. 2017) and all previous ALMA detections in the field reported in Dudzevičiūtė et al. (2020), suggesting that a significant population of dusty galaxies at z > 6 might have been missed by previous submillimeter surveys.
Object CEERS_15937 at z = 4.91 is remarkable, being among the most distant confirmed passive objects. Most importantly, it is the least massive known to date, the only two comparable cases being GS-z5-Q1 and COS-z5-Q1 with a > 3 times larger stellar mass (log(Mstar/M⊙)∼9.5 − 9.6, Baker et al. 2025). Similarly to GS-z5-Q1 and COS-z5-Q1, CEERS_15937 is a member of a known z ≃ 5 overdensity (Naidu et al. 2022b; Arrabal Haro et al. 2023b) together with other known quiescent (de Graaff et al. 2025) and dusty (Zavala et al. 2023; Bisigello et al. 2025) galaxies. The number density and formation pathway of low-mass quiescent galaxies at high redshift are presently unknown (e.g. Merlin et al. 2025). An in-depth investigation of CEERS_15937 and similar objects may shed light on the role of enviroment at early times and on their connection with the recently discovered class of ‘mini-quenched’ galaxies at high redshift (Strait et al. 2023; Looser et al. 2024).
We exploited the analysis described above to perform a detailed evaluation of the objects in our reference sample of F200W dropouts. We first note that two objects in our sample consistently show a probability for the high-redshift solution which is significantly lower than any of the low-and-intermediate redshift peaks: COSMOS_84213 and COSMOS_118438. In the case of COSMOS_84213, this is likely due to a marginal detection (S/N ∼ 2) in one HST band each, albeit it is non-detected in both the ACS and WFC3 stacks that we used for our selection. In addition, this source show a drop in the F410M band similarly to COSMOS_31168, COSMOS_76919, and UDS_56824, thus making dusty star-forming solutions more likely. On the contrary, COSMOS_118438 has a slightly higher flux in F410M than in F356W and F444W, which also leads SED-fitting codes to prefer strong-line emitting templates at z ≲ 6. In fact, we tested that the probability of the z > 15 solution increases after removing the F410M from the fit for all the aforementioned sources. The remaining three sources in our sample have high-redshift solutions as significant as the low-redshift ones in most of the SED-fitting runs. In particular, CEERS_17384 and COSMOS_107923 show a high consistency among all codes and recipes. However, there are compelling reasons to consider their reliability with caution. The CEERS object appear somewhat similar to CEERS_15937, as it has a clear peak corresponding to a passive solution at zphot ∼ 5, leading us to suspect that it is a member of the same z ≃ 5 overdensity (Naidu et al. 2022b; Arrabal Haro et al. 2023b). Finally, COSMOS_107923, albeit being the brightest in the sample falls in a region of relatively shallow image depth and therefore has a corresponding limited sampling of the spectral break. This source also has β ∼ −1.2 which is redder than the UV slopes measured in spectroscopically confirmed objects at z > 10 (Roberts-Borsani et al. 2024, 2025b), with the only notable exception of the X-ray emitting AGN GHZ9 at z = 10.145 (β = −1.1 ± 0.12, Napolitano et al. 2025b).
5. Constraints on the UV LF beyond z = 15
We explore in this section the implications that our findings may have on the evolution of the LF at z > 15. To take into account the caveats discussed above on the potential contamination from rare classes of interlopers, we considered two opposite scenarios regarding the reliability of our F200W dropout sample. In case 1, we assume that all our five candidates are at 15 < z < 20, as indicated by the selection function of Fig. 1. As we describe above, all our candidates were selected following a standard, self-consistent approach, which has proved to be effective at lower redshifts. Despite the concerns described above, we stress that all our candidates are at least consistent with the expected properties of galaxies in this redshift range. While contamination is expected both on the basis of our simulations and selection results (Sect. 3), there are no compelling reasons to reject them a priori. In the opposite case, case 2, we assume that all candidates are interlopers, corresponding to a non-detection of z > 15 sources in every field, and compute the corresponding upper limits on the LF.
5.1. The computation of the LF
The LF has been computed following a standard approach described in detail in Castellano et al. (2023), which takes into account incompleteness and selection effects through imaging simulations that were performed separately for each of the fields. Briefly, we inserted in blank regions of the observed images 2.5 × 10⁵ mock Lyman-break galaxies at 15 < z < 30 and with a uniform distribution at −23.0 < MUV < −18.0 mag. The observed magnitudes were obtained by randomly associating a model from a library based on BC03 models with metallicity Z = 0.02 Z⊙, 0 < E(B − V) < 0.2 mag and a constant SFH. We assumed that objects follow a circular Sersic (1968) light profile with index n = 1. Considering the lack of estimates of the size distribution at these redshifts, we assumed a fixed size of 0.2 kpc, which is consistent with the typical Rh of our candidates. To avoid overcrowding, simulations were performed by inserting 500 objects each time. Detection, photometry, and colour selection on the simulated galaxies were performed in the same way as for the real catalogues. The simulated populations were used to estimate the completeness of our colour selections in each of the considered magnitude bins; hence, the effective volume accessible in each field. In the case of A2744, which is affected by lensing, we adopted the approach in Eq. (1) of Castellano et al. (2023); namely, the effective volumes in each bin are obtained by taking into account the area at different magnification levels computed on the basis of the model by Bergamini et al. (2023), while the relevant completeness for the selection of objects with the considered UV rest-frame magnitudes. Although we remark that no candidates are found in this field, we limited our LF analysis to regions with μ < 5, to avoid the small strongly lensed regions where systematic uncertainties may be significant; in addition, the source multiplicity would need to be taken into account in the simulation process.
We highlight that our procedure for estimating the binned LF does not attempt to include the effect of contamination by leveraging the information contained in P(z) to weight the number of observed objects (see e.g. Donnan et al. 2024). However, for the reasons described above, we believe that the knowledge of the population of potential interlopers in LBG selections at these extreme redshifts is too uncertain at the moment. Thus, we prefer to bracket the various options with the two opposite scenarios described above. The results are reported in Tables 2 (z = 15 − 20) and 3 (z = 20 − 30), and shown in Figs. 7 and 8, respectively.
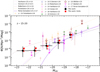 |
Fig. 7. UV LFs at 15 ≤ z ≤ 20 based on the F200W-dropout selection of the ASTRODEEP-JWST catalogues, compared to results from the literature by Harikane et al. (2025), Donnan et al. (2024), Robertson et al. (2024), Casey et al. (2024), Finkelstein et al. (2024), Whitler et al. (2025), Kokorev et al. (2025), Weibel et al. (2025b) (see label for details). The UV LF at 15 ≤ z ≤ 20 is shown for the two scenarios discussed in Sect. 5: assuming that all candidates are at z > 15 (case 1: black circles and error-bars) or that they are all interlopers (case 2: red squares and 1-σ upper limits). |
Binned LFs at z = 15 − 20.
Binned LFs at z = 20 − 30.
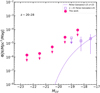 |
Fig. 8. 1-σ upper limits on the UV LFs at 20 ≤ z ≤ 28 based on the non-detection of F277W-dropout candidates in the ASTRODEEP-JWST catalogues, compared to binned and Schechter estimates at z = 25 by Pérez-González et al. (2025a). |
The comparison to available measurements of the LF at z ≃ 14 clearly shows that if all our five F200W-dropout candidates are at z ≃ 15 − 20 (case 1), the LF continues a trend of very slow evolution, similar to recent findings at z = 10 − 15 (Harikane et al. 2025; Donnan et al. 2024; Robertson et al. 2024; Casey et al. 2024; Finkelstein et al. 2024). Our estimates would be in agreement with the measurements at z = 16-18 by Harikane et al. (2024), Whitler et al. (2025), Kokorev et al. (2025) Pérez-González et al. (2025a), and Weibel et al. (2025b) in the same luminosity range. Most importantly, a similar scenario remains valid if we consider partial, but not complete, contamination of our sample and/or successful confirmation of some candidates in our extended sample. In fact, every point in the LF is originated by a small number of observed galaxies falling in that luminosity bin (typically 1 or 2), such that even if a small fraction of candidates is indeed at z > 15, the corresponding density in the considered bin would be comparable to the available estimates at z ∼ 14. In addition, two of our candidates are brighter than the highest redshift secure galaxy JADES-GS-z14-0 (MUV = −20.81, Carniani et al. 2025); if confirmed, they would imply a number density at MUV < −21, which is higher than current measurements at z ∼ 14.
Needless to say, if we assume that none of our candidates are genuinely at z > 15 (case 2), the upper limits simply indicate that the actual LF is located at lower densities and luminosities, to an extent that we cannot establish with the existing data. The reader should not get confused by the fact that the upper limits of this scenario are not significantly different from the positive detections. The 1σ upper limit in case of non-detection, computed on the basis of small number Poisson statistics (Gehrels 1986), corresponds to ≃1.8, a value very close to the observed densities in ‘case 1’.
The estimate of the galaxy number density at 20 < z < 30, for which no reference F277W dropout candidates have been selected, yields a similar conclusion. The derived upper limits are consistent with the z ∼ 25 estimates by Pérez-González et al. (2025a), and somewhat above the existing measurements at z ≃ 14 and at 15 < z < 20, due to the reduced effective volume sampled by our surveys. This result demonstrates that significantly wider and deeper areas are in principle necessary to sample this redshift range. This point is further expanded below.
5.2. Comparison to theoretical predictions
We explore the implications of our results by carrying out a comparison with a variety of theoretical models aimed at explaining the mild evolution of the UV LF beyond z ≃ 10, in Figs. 9 and 10.
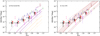 |
Fig. 9. Comparison between the UV LF at 15 ≤ z ≤ 20 (symbols as in Fig. 7) and two empirical models at different redshifts as indicated by the relevant labels: (a) model based on the Sheth & Tormen (1999) HMF and the LUV/MH at z = 5 by Mason et al. (2015) brightened by one magnitude to match the z ∼ 12.5 UV LF; (b) model maximising the abundance of high-redshift galaxies (see Sect. 5.2). In both panels are included for reference the binned LFs measured by Donnan et al. (2024) (z = 12.5), Whitler et al. (2025) (z = 16), Kokorev et al. (2025) (z = 18), and Pérez-González et al. (2025a) (z = 17 and z = 25), with symbol meanings as in Fig. 7. |
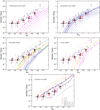 |
Fig. 10. Same as Fig. 9 for self-consistent theoretical models: (c) attenuation-free model (Ferrara et al. 2023, 2025b; Ziparo et al. 2023; d) feedback-free model with ϵ = 0.3 (shaded region encloses predictions for 0.2 ≤ ϵ ≤ 0.5 at z = 15) (Dekel et al. 2023; Li et al. 2024; e) DELPHI fiducial (blue), eSFE (green), and eIMF (orange) models by Mauerhofer et al. (2025); (f) CAT models (Trinca et al. 2024) with standard (magenta) and evolving IMF (orange); (g) Santa Cruz SAM (Somerville et al. 2025), with dense gas fraction fdense = 0.1, 0.5, 1. |
5.2.1. Empirical models
To put our results in context, we first present a simple comparison with an empirically-adjusted, theoretically-motivated LF. The model is obtained starting from a standard calculation of the cold dark matter halo mass function (CDM-HMF). We adopt the Sheth & Tormen (1999) form, assuming a CDM linear power spectrum. Compared to other expressions proposed so far for the halo mass function (e.g. Yung et al. 2024a), this form provides the most extended high-mass tail and thus constitutes the most conservative form for our goals. This HMF is converted directly into a UV LF assuming the LUV − MH conversion curve at z = 5 by Mason et al. (2015), brightened by exactly one magnitude to broadly match the observed z ∼ 12.5 UV LF by Donnan et al. (2024). We remark that we make no effort to physically motivate this brightening, which can be ascribed to a number of effects. We use it simply as a reference point to illustrate the evolution of the UV LF at higher redshifts under simple assumptions.
We then evolve the LF up to z = 30 at z > 12 under the assumption of a non-evolving LUV/MH, which is shown in the same panel of Fig. 9. In practice, the entire evolution of the LF is driven by the corresponding evolution of the Press & Schechter HMF. As can be seen, the resulting evolution is extremely accelerated beyond z = 12, with a drop of up to two orders of magnitude at MUV ∼ −19 from z = 12 to z = 16, and four orders of magnitudes up to z = 30, or, equivalently, by a drop in luminosity at constant density of about two magnitudes from z = 12 to z = 16 and more than 4 mag from z = 12 to z = 30. By construction, this reflects the evolution of the critical mass for collapse in the standard Λ–CDM model, that indeed evolves dramatically at these redshifts (e.g. Menci et al. 2024). While the assumption of a constant LUV/MH beyond z ≃ 12 is certainly coarse and inadequate, it is a useful exercise to demonstrate how hard it is to imagine physical mechanisms that may effectively compensate for this fast evolution and maintain the UV LF significantly higher.
As an opposite case, we built an empirical model explicitly aimed at maximising the abundance of high-redshift galaxies under the extreme assumption that all baryons accreted onto a DM halo are instantaneously converted into stars (max SFE model). Specifically, we assume that the SFR equals the baryonic mass growth  , where fb = Ωb/Ωm is the baryon mass fraction and
  is the dark-matter mass growth rate. The latter is computed after the fitting formula (based on N-body simulations) given in Correa et al. (2015), which depends on the halo mass mh and on the redshift. The UV luminosity associated with the different halo masses is then computed by assuming a SFE of ϵ = 1 and a LUV/Mstar ratio for a dust-free template with a metallicity of Z = 0.02 Z⊙, age = 10 Myr, and a Chabrier (2003) IMF. Notably, the resulting UV LFs at z ≥ 15 fall below our measurements (Fig. 9, right panel). To further include effects that maximise the UV luminosity associated with a given dark matter halo, we also allowed for a stochastic fluctuation of the SFR, adopting the simplified description proposed by Kravtsov & Belokurov (2024). In this approach, the SFR is multiplied by 10Δ, where Δ is a correlated random number drawn from a Gaussian distribution with zero mean. Since our aim is not to provide a best-fit of the LFs but rather to derive a maximal UV luminosity associated with dark matter halos, we adopt a simplified treatment, where – instead of extracting Δ from a proper distribution – we assume for it a fixed value Δ = 0.5. This is larger than the typical range for the rms value σΔ = 0.08 − 0.4 resulting from the analysis of stochasticity of the SFR in the high-resolution zoom-in simulations by Kravtsov & Belokurov (2024), and definitely larger than the value σΔ = 0.15 they assume in their best-fitting models for the UV LFs. Only the additional effect of extreme stochasticity, highlighted by a shaded region in Fig. 9, allows this simple empirical model to match the number density inferred from our reference F200W dropout sample (consistently with the results by Pallottini & Ferrara 2023). A similar result may be obtained by allowing for top-heavy, or flat IMFs, which can increase LUV by up to a factor of ∼10 compared to a Chabrier IMF.
These simple tests suggest that any smoothly evolving theoretical extrapolation of the z ∼ 12 UV LF would predict an evolution at z > 15 stronger than our estimates. Also, it is clear that additional physical mechanisms must be at play to match such a high abundance of bright galaxies.
5.2.2. Analytic and semi-analytic models
A number of self-consistent physical models were explored to understand the high-abundance of bright galaxies observed at z ≳ 9 by JWST. In the attenuation-free model (AFM, Ferrara et al. 2023, 2025b; Ziparo et al. 2023; Fiore et al. 2023) radiation-driven outflows expel or lift the previously formed dust, thus boosting the UV luminosity to an extent that matches the observed LFs at z ∼ 10 − 14. In the feedback-free starbursts (FFB, Dekel et al. 2023; Li et al. 2024) scenario, the excess of bright galaxies is explained as the result of high densities and low metallicities yielding a extremly high SFE at cosmic dawn4. The DELPHI semi-analytic model (SAM) based on cold gas fractions and SFE results sampled from the SPHINX simulations (Mauerhofer et al. 2025) explored two different mechanisms boosting the abundance of galaxies at z ≳ 9: a stellar initial mass function (IMF) that becomes increasingly top-heavy with decreasing metallicity and increasing redshift (eIMF model), and SFE values that increase with increasing redshift (eSFE model). Similarly, the CAT SAM invokes a gradual transition in the IMF, modulated by metallicity and redshift to match the UV LFs at very high redshift (Trinca et al. 2024). Finally, the recently updated Santa Cruz semi-analytic model (Yung et al. 2024b; Somerville et al. 2025) was run on dark matter halo merger trees extracted from the GUREFT simulations (Yung et al. 2024a), and incorporates a SFE that increases with increasing gas surface density, motivated by results from molecular cloud-scale simulations with radiative transfer. As overall galaxy surface densities are naturally predicted to be higher at early times in the ΛCDM picture, these models predict higher SFE values and, therefore, more UV luminous galaxies at early times. The free parameter fdense represents the fraction of the ISM that is in dense, star-forming clouds.
Consistently with the simple empirical predictions described above, all these theoretical scenarios point towards a strong evolution at z > 15 (Fig. 10). Both the AFM model, and the FFB one with an SFE of ϵ = 0.3, provide a good match to the z ∼ 12 UV LF but while the AFM predicts an abundance of galaxies at z > 15 lower than our case 1 LF, the FFB model with 0.2 ≤ ϵ ≤ 0.5 is consistent with our estimates at MUV > −22. The CAT SAM based on a standard IMF (Trinca et al. 2024), the DELPHI fiducial model, and the Santa Cruz SAM with fdense = 0.1, fall below our estimates.
Interestingly, ≳2σ tensions are found at the brightest magnitudes, i.e. at MUV < −22 in the case of the FFB model, and at MUV < −20 for the others. The tensions are apparently alleviated when assuming a change in physical properties. The DELPHI eIMF and eSFE models, and the CAT model assuming an evolving IMF, are partially consistent with our estimates at MUV ∼ −18.5 − 19.5. An evolution of the dense gas fraction from ∼0.1 at z = 13 to fdense > 0.5 could match our estimates at all luminosities according to the Santa Cruz SAM, while the FFB model with ϵ = 1 would match the observed case 1 abundance in the brightest bin. These comparisons help us to put the results presented in this paper in context, leading to our main conclusions:
– If even a fraction of the candidates presented here are indeed located at z ≳ 15, the tension with existing theoretical models would be significant. In particular, the confirmation of bright (MUV < −21) candidates would require deep revisions of our theoretical framework. A high abundance at the bright-end would imply a SFE close to 100% or a substantial contribution from AGNs or other very luminous sources, such as black holes (Pacucci et al. 2022) or primordial black holes (Matteri et al. 2025). In addition, a successful confirmation of any of the candidates in the extended F277W dropout sample (see Appendix A) would imply a dramatic discrepancy with all theoretical models.
– If, instead, all these candidates are interlopers, we are compelled to conclude that future surveys will need to cover much wider areas to secure the selection of bright galaxies significantly beyond z = 15 and to test predictions of current theoretical models. We further investigate this point in the next section.
6. Designing a survey to break the z = 15 barrier
We built on the analysis of the ASTRODEEP-JWST fields to constrain the requirements for future observations designed to individuate robust samples of galaxies at z > 15. We first discuss how to improve the robustness of candidate selection. We use the properties of potential, rare low-redshift contaminants discussed in Sect. 4.2 to constrain the relative depth between different JWST bands capable of discriminating between interlopers and genuine high-redshift galaxies. We note that in the surveys analysed here the bands immediately bluewards of the Lyman break; namely, F150W and F200W, are typically shallower by ∼0.5 mag and up to ∼1 mag than the LW bands F356W and F444W sampling the UV continuum up to z ∼ 30. We have thus used the expected fluxes of all templates at 0 < z < 8 that provide a good fit to our candidates to build mock JWST catalogues varying the relative depth between the various filters. We consider templates of the low-redshift solutions of all our samples, namely, the reference F200W dropout objects and the extended samples of F200W and F277W dropouts, and perturb the predicted fluxes with random Gaussian noise. We compared a reference scenario in which the NIRCam SW bands are 0.5 mags shallower than the LW ones, similarly to the observed fields, to scenarios in which the SW bands are as deep or deeper than the LW ones. For simplicity, we normalise the templates to have mag = 29 in the F356W band and fix a depth 29AB at S/N = 10 in the same band in all our simulations.
As expected, we find that the bands immediately redwards of the expected break are crucial for discriminating between low- and high-redshift solutions. Increasing the depth of the F090W and/or F115W bands is basically ineffective in reducing the contamination rate, while having both F150W and the F200W as deep as the LW bands reduces by a factor of 3 the fraction of templates contaminating the colour selections. The best advantage is obtained when the two bands are 0.5 mag deeper than the LW ones at fixed S/N. In such a case, the contamination fraction is reduced by a factor of ∼10. Most importantly, such a deeper imaging at 1.5−2 μm would make it possible to adopt the more inclusive colour threshold (F200W − F277W) > 1.0 (z ∼ 15 − 20, see Fig. 1) with a contamination rate of < 0.5% of the considered templates, with a significant gain in the accessible colour space. Our analysis is in good agreement with the results by Adams et al. (2025), showing that doubling the exposure time in the bands sampling below the break is the most efficient way to reduce contamination in a standard high-redshift survey.
We go on to address the question of the survey area required to detect a given number of sources as predicted by the various theoretical models discussed in the previous section. The results are shown in Fig. 11. Finding at least one object at the very bright end (MUV < −20) of the UV LF at 15 ≤ z ≤ 20 requires reaching a continuum magnitude around 28 (at S/N = 10) over an area of ≳3000 sq. arcmin in most of the scenarios. Consistently with Figure 10, only models with an extreme level of SFE would predict the detection of one object on areas comparable to our current data set (≃600 sq. arcmin). Conversely, if we aim towards the faint side of the LF (MUV < −17) at 15 ≤ z ≤ 20, an area of ≃5 sq. arcmin at a depth around m = 31 would be required to detect one object. Following our tests, in both cases observations at least 0.5 mags deeper are required in the F150W and F200W bands to perform an unambiguous selection.
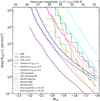 |
Fig. 11. Area at which at least one object brighter than MUV at 15 ≤ z ≤ 20 is expected according to the following theoretical predictions (see label for details): Attenuation-free model (Ferrara et al. 2023, 2025b; Ziparo et al. 2023); feedback-free model with ϵ = 0.3 and with ϵ = 0.5 (Dekel et al. 2023; Li et al. 2024); DELPHI fiducial, eSFE and eIMF models by Mauerhofer et al. (2025); CAT models (Trinca et al. 2024) with standard and evolving IMF; Santa Cruz SAM (Somerville et al. 2025), with dense gas fraction fdense = 0.1, 0.5, 1; empirical fine-tuned M/L model (see Sect. 5.2). The top axis shows the corresponding observed continuum magnitude (at rest-frame wavelength λrf = 1500 Å) assuming z = 17. The dash-dotted cyan line shows the Nobj = 1 area versus MUV for the empirical fine-tuned M/L model at 20 ≤ z ≤ 30: the relevant observed magnitude at z = 25 is fainter by 0.52 mag than the scale shown on top. |
With these values in mind, it is intriguing to estimate the JWST observing time needed to reach these combinations of depth and size. For the bright side (MUV ≤ −20), according to the JWST exposure time calculator, NIRCam can observe at a depth of ≃28.5 at S/N = 10 both the F150W, F200W bands with a total of ∼2.5 hours of net exposure time per pointing. The simultaneous observation in two channels allows to observe F277W, F356W, and F444W at ≃28 (S/N = 10). An area of 12 000 sq. arcmin would (according to most predictions) enable the detection of at least two to three sources with MUV ≤ −20; however, this would also require an investment of no less than ∼3000 hours, plus overhead. Similarly, a deep pencil-beam NIRCam pointing in the F150W, F200W, F277W, and F356W bands to unambiguously detect at S/N = 10 at least two ultra-faint objects of continuum mag ≃31 AB requires more than 1300 hours of net exposure. While this simple exercise is only meant to provide an order-of-magnitude estimate of the time needed for robust photometric selections, it clearly highlights that a thorough characterization of the available candidates and potential contaminants should be considered a prerequisite for any future efforts in this direction.
7. Summary and conclusions
The high abundance of galaxies beyond z ≈ 10 can potentially be explained on the basis of several competing scenarios. Extending the constraints on the UV LF to the poorly explored range at z > 15 allows us to discriminate among different theoretical models as well as to individuate bright galaxies, which are crucial in expanding our knowledge of the first phases of galaxy formation. To this aim, we analysed the ASTRODEEP-JWST photometric sample by Merlin et al. (2024), which provides consistent measurements on the major JWST deep surveys, to select bright galaxy candidates at z ∼ 15 − 30. On the basis of mock observations mimicking the properties of our dataset, we designed specific renditions of the Lyman-break selection technique that are able to efficiently identify galaxy candidates in the redshift ranges 15 ≤ z ≤ 20 and 20 ≤ z ≤ 28.
We isolated five candidates at 15 ≤ z ≤ 20, whereas no objects were found at z ≳ 20. A closer inspection of the selected candidates shows that despite exhibiting a > 1.5 mag break, the selected objects consistently display multimodal redshift probability distributions P(z) across different SED fitting codes and methodologies. The alternative solutions cover regions in the sSFR versus E(B − V) and E(B − V) versus Mstar planes that diverge from the general populations at the same redshifts. Most importantly, they correspond to populations of low-mass (∼107 − 109 M⊙) quiescent or dusty galaxies that have not been thoroughly investigated thus far. This result is corroborated by the spectral properties of five confirmed interlopers of our F200W dropout selection. Four objects are found to be dusty star-forming galaxies, including three low-mass (log M*/M⊙ ≃ 7.6 − 8.8) objects at z ∼ 2 − 5 and a highly attenuated (E(B − V) = 0.8) starburst galaxy at z = 6.56, characterised by a mass of log M*/M⊙ = 9.8. The fifth confirmed interloper, CEERS_15937 at z = 4.91, was found to be the first spectroscopically confirmed passive galaxy with log(Mstar/M⊙)≲9 at high redshift. These results imply that while our candidates are, in principle, credible objects at 15 < z < 20, none of them would pass stringent selection criteria based on Δχ2 between different redshift solutions. In addition, considering that the low-redshift templates populate an essentially unexplored parameter space whose galaxy density is unconstrained, using their P(z) as a weight to estimate the high-redshift UV LF appears to be an approach that is still rife with uncertainties.
We adopted a more pragmatic approach of estimating the UV LF at z ≈ 15 − 20 by assuming different contamination levels. The UV LF based on the, admittedly extreme, assumption of negligible contamination indicates a very mild evolution compared to estimates at immediately lower redshifts, at odds with all theoretical predictions. In particular, the confirmation of bright (MUV < −21) candidates would require deep revisions of our theoretical framework and it might be even in contradiction to any plausible model under a standard Λ–CDM cosmological scenario. The tension with theoretical models implies that even if only a small fraction of the candidates were to be confirmed to be at z > 15, a further evolution of physical properties (e.g. IMF or SFE) would be required to explain the observed number densities. If, instead, all the analysed candidates were interlopers, we would be compelled to conclude that future surveys will need to cover much wider areas to secure the selection of bright galaxies significantly beyond z = 15.
According to a variety of theoretical models, finding at least one object at the very bright end (MUV < −20) of the UV LF requires surveying very large areas, ranging from ∼500 sq. arcmin. to ≳1000 sq. arcmin at 15 ≤ z ≤ 20, and to more than 2000 sq. arcmin at z ≥ 20. However, our analysis shows that a large area coverage is not the only required ingredient, because the depth achieved by current surveys is not optimal with respect to avoiding contamination. A simple test based on the properties of the low-redshift solutions of our candidates indicates that NIRCam imaging in the F150W and F200W bands should be at least as deep as the observations in NIRCam LW bands, and possibly 0.5 mag deeper, to decrease the contamination rate significantly. This is a demanding requirement for both ultra-deep pencil beam observations targeting the LF faint-end and for large area surveys sampling the bright-end. We argue that a more pragmatic approach should primarily be aimed at conducting a thorough spectroscopic characterisation of the candidates available from current surveys and of potential contaminating populations to gather key information for planning future surveys aimed at breaking current redshift records.
https://dawn-cph.github.io/dja/index.html to check whether candidates have imaging observations in NIRCam bands that were not included in M24. We find that candidate JADES-GN_9538 is covered by NIRCam medium-band observations in the F182M, F210M, and F335M bands. It has a marginal (∼2σ) detection in the F182M band, it is not detected in the F210M one, and a 6σ detection in F335M, resulting in a flat F335M–F356W colour. We discuss in Sect. 4.1 the implication of MIRI and NIRCam medium-band observations on the redshift probability distribution of our candidates.
The predictions used in the present work incorporate the improved estimate of the UV luminosity based on the median SFH, as described in Dekel et al. (2025).
Acknowledgments
We thank the referee for the constructive comments that helped us improve the manuscript. We thank J. Dunlop and R. Ellis for the useful discussions. We acknowledge financial support from NASA through grant JWST-ERS-1324. Support was also provided by the PRIN 2022 MUR project 2022CB3PJ3 – First Light And Galaxy aSsembly (FLAGS) funded by the European Union – Next Generation EU, by INAF Mini-grant “Reionization and Fundamental Cosmology with High-Redshift Galaxies”, and by INAF GO Grant “Revealing the nature of bright galaxies at cosmic dawn with deep JWST spectroscopy”. P.G.P.-G. and L.C. acknowledge support from grant PID2022-139567NB-I00 funded by Spanish Ministerio de Ciencia e Innovación MCIN/AEI/10.13039/501100011033, FEDER Una manera de hacer Europa. L.N. acknowledges support from grant “Progetti per Avvio alla Ricerca – Tipo 1, Unveiling Cosmic Dawn: Galaxy Evolution with CAPERS” (AR1241906F947685). RA acknowledges financial support from grants PID2023-147386NB-I00 “XTREM” and PID2022-136598NB-C32 “Estallidos8”, funded by MCIU/AEI/10.13039/501100011033 and ERDF/EU, and the State Agency for Research of the Spanish MCIU through ‘Center of Excellence Severo Ochoa’ award to the IAA-CSIC (SEV-2017-0709) and CEX2021-001131-S. F.P. acknowledges support from a Clay Fellowship administered by the Smithsonian Astrophysical Observatory. The Flatiron Institute is supported by the Simons Foundation. This work is based on observations made with the NASA/ESA/CSA James Webb Space Telescope. The data were obtained from the Mikulski Archive for Space Telescopes at the Space Telescope Science Institute, which is operated by the Association of Universities for Research in Astronomy, Inc., under NASA contract NAS 5-03127 for JWST. These observations are associated with programmes #1324, 1345, 1180, 1210, 1837, 2561, 2756, 3794, 3990, 5893, and 6368. This paper makes use of the following ALMA data: ADS/JAO.ALMA#2015.1.01074.S. ALMA is a partnership of ESO (representing its member states), NSF (USA) and NINS (Japan), together with NRC (Canada), NSTC and ASIAA (Taiwan), and KASI (Republic of Korea), in cooperation with the Republic of Chile. The Joint ALMA Observatory is operated by ESO, AUI/NRAO and NAOJ. Some of the data products presented herein were retrieved from the Dawn JWST Archive (DJA). DJA is an initiative of the Cosmic Dawn Center (DAWN), which is funded by the Danish National Research Foundation under grant DNRF140.
References
- Adams, N. J., Austin, D., Harvey, T., et al. 2025, MNRAS, 542, 1705 [Google Scholar]
- Algera, H. S. B., Inami, H., De Looze, I., et al. 2024, MNRAS, 533, 3098 [NASA ADS] [CrossRef] [Google Scholar]
- Arrabal Haro, P., Dickinson, M., Finkelstein, S. L., et al. 2023a, ApJ, 951, L22 [NASA ADS] [CrossRef] [Google Scholar]
- Arrabal Haro, P., Dickinson, M., Finkelstein, S. L., et al. 2023b, Nature, 622, 707 [NASA ADS] [CrossRef] [Google Scholar]
- Austin, D., Adams, N., Conselice, C. J., et al. 2023, ApJ, 952, L7 [NASA ADS] [CrossRef] [Google Scholar]
- Bagley, M. B., Pirzkal, N., Finkelstein, S. L., et al. 2024, ApJ, 965, L6 [NASA ADS] [CrossRef] [Google Scholar]
- Baker, W. M., Ito, K., Valentino, F., et al. 2025, A&A, submitted [arXiv:2509.09761] [Google Scholar]
- Bergamini, P., Acebron, A., Grillo, C., et al. 2023, ApJ, 952, 84 [NASA ADS] [CrossRef] [Google Scholar]
- Bertin, E., & Arnouts, S. 1996, A&AS, 117, 393 [NASA ADS] [CrossRef] [EDP Sciences] [Google Scholar]
- Bezanson, R., Labbe, I., Whitaker, K. E., et al. 2024, ApJ, 974, 92 [NASA ADS] [CrossRef] [Google Scholar]
- Birrer, S., Shajib, A., Gilman, D., et al. 2021, J. Open Source Softw., 6, 3283 [NASA ADS] [CrossRef] [Google Scholar]
- Bisigello, L., Gandolfi, G., Grazian, A., et al. 2023, A&A, 676, A76 [NASA ADS] [CrossRef] [EDP Sciences] [Google Scholar]
- Bisigello, L., Gandolfi, G., Feltre, A., et al. 2025, A&A, 693, L18 [NASA ADS] [CrossRef] [EDP Sciences] [Google Scholar]
- Boquien, M., Burgarella, D., Roehlly, Y., et al. 2019, A&A, 622, A103 [NASA ADS] [CrossRef] [EDP Sciences] [Google Scholar]
- Bouwens, R., González-López, J., Aravena, M., et al. 2020, ApJ, 902, 112 [NASA ADS] [CrossRef] [Google Scholar]
- Bouwens, R. J., Oesch, P. A., Stefanon, M., et al. 2021, AJ, 162, 47 [NASA ADS] [CrossRef] [Google Scholar]
- Brammer, G. B., van Dokkum, P. G., & Coppi, P. 2008, ApJ, 686, 1503 [Google Scholar]
- Bruzual, G., & Charlot, S. 2003, MNRAS, 344, 1000 [NASA ADS] [CrossRef] [Google Scholar]
- Calzetti, D., Armus, L., Bohlin, R. C., et al. 2000, ApJ, 533, 682 [NASA ADS] [CrossRef] [Google Scholar]
- Carnall, A. C., McLure, R. J., Dunlop, J. S., & Davé, R. 2018, MNRAS, 480, 4379 [Google Scholar]
- Carnall, A. C., McLure, R. J., Dunlop, J. S., et al. 2019, MNRAS, 490, 417 [Google Scholar]
- Carnall, A. C., Cullen, F., McLure, R. J., et al. 2024, MNRAS, 534, 325 [NASA ADS] [CrossRef] [Google Scholar]
- Carniani, S., Hainline, K., D’Eugenio, F., et al. 2024, Nature, 633, 318 [CrossRef] [Google Scholar]
- Carniani, S., D’Eugenio, F., Ji, X., et al. 2025, A&A, 696, A87 [NASA ADS] [CrossRef] [EDP Sciences] [Google Scholar]
- Casey, C. M., Zavala, J. A., Aravena, M., et al. 2019, ApJ, 887, 55 [Google Scholar]
- Casey, C. M., Akins, H. B., Shuntov, M., et al. 2024, ApJ, 965, 98 [NASA ADS] [CrossRef] [Google Scholar]
- Castellano, M., Sommariva, V., Fontana, A., et al. 2014, A&A, 566, A19 [NASA ADS] [CrossRef] [EDP Sciences] [Google Scholar]
- Castellano, M., Fontana, A., Treu, T., et al. 2022, ApJ, 938, L15 [NASA ADS] [CrossRef] [Google Scholar]
- Castellano, M., Fontana, A., Treu, T., et al. 2023, ApJ, 948, L14 [NASA ADS] [CrossRef] [Google Scholar]
- Castellano, M., Napolitano, L., Fontana, A., et al. 2024, ApJ, 972, 143 [Google Scholar]
- Chabrier, G. 2003, PASP, 115, 763 [Google Scholar]
- Cole, J. W., Papovich, C., Finkelstein, S. L., et al. 2025, ApJ, 979, 193 [Google Scholar]
- Conselice, C. J., Adams, N., Harvey, T., et al. 2025, ApJ, 983, 30 [Google Scholar]
- Correa, C. A., Wyithe, J. S. B., Schaye, J., & Duffy, A. R. 2015, MNRAS, 450, 1514 [NASA ADS] [CrossRef] [Google Scholar]
- Dale, D. A., Helou, G., Magdis, G. E., et al. 2014, ApJ, 784, 83 [Google Scholar]
- de Graaff, A., Setton, D. J., Brammer, G., et al. 2025, Nat. Astron., 9, 280 [Google Scholar]
- Dekel, A., Sarkar, K. C., Birnboim, Y., Mandelker, N., & Li, Z. 2023, MNRAS, 523, 3201 [NASA ADS] [CrossRef] [Google Scholar]
- Dekel, A., Mandelker, N., Li, Z., et al. 2025, MNRAS, 544, 160 [Google Scholar]
- Ding, X., Silverman, J., Treu, T., et al. 2020, ApJ, 888, 37 [NASA ADS] [CrossRef] [Google Scholar]
- Donnan, C. T., McLeod, D. J., McLure, R. J., et al. 2023, MNRAS, 520, 4554 [NASA ADS] [CrossRef] [Google Scholar]
- Donnan, C. T., McLure, R. J., Dunlop, J. S., et al. 2024, MNRAS, 533, 3222 [NASA ADS] [CrossRef] [Google Scholar]
- Dudzevičiūtė, U., Smail, I., Swinbank, A. M., et al. 2020, MNRAS, 494, 3828 [Google Scholar]
- Eisenstein, D. J., Willott, C., Alberts, S., et al. 2023, ApJS, submitted [arXiv:2306.02465] [Google Scholar]
- Ferland, G. J., Porter, R. L., van Hoof, P. A. M., et al. 2013, Rev. Mex. Astron. Astrofis., 49, 137 [Google Scholar]
- Ferrara, A., Pallottini, A., & Dayal, P. 2023, MNRAS, 522, 3986 [NASA ADS] [CrossRef] [Google Scholar]
- Ferrara, A., Pallottini, A., & Sommovigo, L. 2025a, A&A, 694, A286 [NASA ADS] [CrossRef] [EDP Sciences] [Google Scholar]
- Ferrara, A., Carniani, S., di Mascia, F., et al. 2025b, A&A, 694, A215 [NASA ADS] [CrossRef] [EDP Sciences] [Google Scholar]
- Finkelstein, S. L., Bagley, M. B., Arrabal Haro, P., et al. 2022, ApJ, 940, L55 [NASA ADS] [CrossRef] [Google Scholar]
- Finkelstein, S. L., Leung, G. C. K., Bagley, M. B., et al. 2024, ApJ, 969, L2 [NASA ADS] [CrossRef] [Google Scholar]
- Finkelstein, S. L., Bagley, M. B., Arrabal Haro, P., et al. 2025, ApJ, 983, L4 [Google Scholar]
- Fiore, F., Ferrara, A., Bischetti, M., Feruglio, C., & Travascio, A. 2023, ApJ, 943, L27 [NASA ADS] [CrossRef] [Google Scholar]
- Fontana, A., D’Odorico, S., Poli, F., et al. 2000, AJ, 120, 2206 [NASA ADS] [CrossRef] [Google Scholar]
- Gandolfi, G., Lapi, A., Ronconi, T., & Danese, L. 2022, Universe, 8, 589 [Google Scholar]
- Gandolfi, G., Rodighiero, G., Bisigello, L., et al. 2025, A&A, submitted [arXiv:2502.02637] [Google Scholar]
- Geach, J. E., Dunlop, J. S., Halpern, M., et al. 2017, MNRAS, 465, 1789 [Google Scholar]
- Gehrels, N. 1986, ApJ, 303, 336 [Google Scholar]
- Giavalisco, M. 2002, ARA&A, 40, 579 [Google Scholar]
- Glazebrook, K., Nanayakkara, T., Jacobs, C., et al. 2023, ApJ, 947, L25 [NASA ADS] [CrossRef] [Google Scholar]
- Glazebrook, K., Nanayakkara, T., Schreiber, C., et al. 2024, Nature, 628, 277 [NASA ADS] [CrossRef] [Google Scholar]
- Grogin, N. A., Kocevski, D. D., Faber, S. M., et al. 2011, ApJS, 197, 35 [NASA ADS] [CrossRef] [Google Scholar]
- Hainline, K. N., Johnson, B. D., Robertson, B., et al. 2024, ApJ, 964, 71 [CrossRef] [Google Scholar]
- Harikane, Y., Ouchi, M., Oguri, M., et al. 2023, ApJS, 265, 5 [NASA ADS] [CrossRef] [Google Scholar]
- Harikane, Y., Nakajima, K., Ouchi, M., et al. 2024, ApJ, 960, 56 [NASA ADS] [CrossRef] [Google Scholar]
- Harikane, Y., Inoue, A. K., Ellis, R. S., et al. 2025, ApJ, 980, 138 [NASA ADS] [Google Scholar]
- Haslbauer, M., Kroupa, P., Zonoozi, A. H., & Haghi, H. 2022, ApJ, 939, L31 [NASA ADS] [CrossRef] [Google Scholar]
- Holwerda, B. W., Bridge, J. S., Ryan, R., et al. 2018, A&A, 620, A132 [NASA ADS] [CrossRef] [EDP Sciences] [Google Scholar]
- Holwerda, B. W., Hsu, C.-C., Hathi, N., et al. 2024, MNRAS, 529, 1067 [NASA ADS] [CrossRef] [Google Scholar]
- Hutter, A., Cueto, E. R., Dayal, P., et al. 2025, A&A, 694, A254 [NASA ADS] [CrossRef] [EDP Sciences] [Google Scholar]
- Juneau, S., Bournaud, F., Charlot, S., et al. 2014, ApJ, 788, 88 [NASA ADS] [CrossRef] [Google Scholar]
- Killi, M., Watson, D., Brammer, G., et al. 2024, A&A, 691, A52 [NASA ADS] [CrossRef] [EDP Sciences] [Google Scholar]
- Koekemoer, A. M., Faber, S. M., Ferguson, H. C., et al. 2011, ApJS, 197, 36 [NASA ADS] [CrossRef] [Google Scholar]
- Kokorev, V., Atek, H., Chisholm, J., et al. 2025, ApJ, 983, L22 [Google Scholar]
- Kravtsov, A., & Belokurov, V. 2024, ArXiv e-prints [arXiv:2405.04578] [Google Scholar]
- Kron, R. G. 1980, ApJS, 43, 305 [Google Scholar]
- Larson, R. L., Hutchison, T. A., Bagley, M., et al. 2023, ApJ, 958, 141 [NASA ADS] [CrossRef] [Google Scholar]
- Leung, G. C. K., Bagley, M. B., Finkelstein, S. L., et al. 2023, ApJ, 954, L46 [NASA ADS] [CrossRef] [Google Scholar]
- Li, Z., Dekel, A., Sarkar, K. C., et al. 2024, A&A, 690, A108 [NASA ADS] [CrossRef] [EDP Sciences] [Google Scholar]
- Looser, T. J., D’Eugenio, F., Maiolino, R., et al. 2024, Nature, 629, 53 [Google Scholar]
- Marley, M. S., Saumon, D., Visscher, C., et al. 2021, ApJ, 920, 85 [NASA ADS] [CrossRef] [Google Scholar]
- Mason, C. A., Trenti, M., & Treu, T. 2015, ApJ, 813, 21 [NASA ADS] [CrossRef] [Google Scholar]
- Matteri, A., Ferrara, A., & Pallottini, A. 2025, A&A, 701, A186 [NASA ADS] [CrossRef] [EDP Sciences] [Google Scholar]
- Mauerhofer, V., Dayal, P., Haehnelt, M. G., et al. 2025, A&A, 696, A157 [NASA ADS] [CrossRef] [EDP Sciences] [Google Scholar]
- McGaugh, S. S., Schombert, J. M., Lelli, F., & Franck, J. 2024, ApJ, 976, 13 [NASA ADS] [CrossRef] [Google Scholar]
- McLeod, D. J., Donnan, C. T., McLure, R. J., et al. 2024, MNRAS, 527, 5004 [Google Scholar]
- McLure, R. J., Dunlop, J. S., Cullen, F., et al. 2018, MNRAS, 476, 3991 [Google Scholar]
- Menci, N., Sen, A. A., & Castellano, M. 2024, ApJ, 976, 227 [Google Scholar]
- Merlin, E., Pilo, S., Fontana, A., et al. 2019, A&A, 622, A169 [NASA ADS] [CrossRef] [EDP Sciences] [Google Scholar]
- Merlin, E., Bonchi, A., Paris, D., et al. 2022, ApJ, 938, L14 [NASA ADS] [CrossRef] [Google Scholar]
- Merlin, E., Santini, P., Paris, D., et al. 2024, A&A, 691, A240 [NASA ADS] [CrossRef] [EDP Sciences] [Google Scholar]
- Merlin, E., Fortuni, F., Calabró, A., et al. 2025, Open J. Astrophys., submitted [arXiv:2509.09764] [Google Scholar]
- Mitsuhashi, I., Harikane, Y., Bauer, F. E., et al. 2024, ApJ, 971, 161 [NASA ADS] [CrossRef] [Google Scholar]
- Morishita, T., Mason, C. A., Kreilgaard, K. C., et al. 2025, ApJ, 983, 152 [Google Scholar]
- Naidu, R. P., Matthee, J., Oesch, P. A., et al. 2022a, MNRAS, 510, 4582 [CrossRef] [Google Scholar]
- Naidu, R. P., Oesch, P. A., Setton, D. J., et al. 2022b, ApJ, submitted [arXiv:2208.02794] [Google Scholar]
- Naidu, R. P., Oesch, P. A., Brammer, G., et al. 2025, Open J. Astrophys., submitted [arXiv:2505.11263] [Google Scholar]
- Napolitano, L., Castellano, M., Pentericci, L., et al. 2025a, A&A, 693, A50 [NASA ADS] [CrossRef] [EDP Sciences] [Google Scholar]
- Napolitano, L., Castellano, M., Pentericci, L., et al. 2025b, ApJ, 989, 75 [Google Scholar]
- Oesch, P. A., Brammer, G., Naidu, R. P., et al. 2023, MNRAS, 525, 2864 [NASA ADS] [CrossRef] [Google Scholar]
- Oke, J. B., & Gunn, J. E. 1983, ApJ, 266, 713 [NASA ADS] [CrossRef] [Google Scholar]
- Ono, Y., Ouchi, M., Harikane, Y., et al. 2025, ApJ, 991, 222 [Google Scholar]
- Pacucci, F., Dayal, P., Harikane, Y., Inoue, A. K., & Loeb, A. 2022, MNRAS, 514, L6 [NASA ADS] [CrossRef] [Google Scholar]
- Pacucci, F., Nguyen, B., Carniani, S., Maiolino, R., & Fan, X. 2023, ApJ, 957, L3 [CrossRef] [Google Scholar]
- Pallottini, A., & Ferrara, A. 2023, A&A, 677, L4 [NASA ADS] [CrossRef] [EDP Sciences] [Google Scholar]
- Paris, D., Merlin, E., Fontana, A., et al. 2023, ApJ, 952, 20 [CrossRef] [Google Scholar]
- Pérez-González, P. G., Barro, G., Annunziatella, M., et al. 2023a, ApJ, 946, L16 [CrossRef] [Google Scholar]
- Pérez-González, P. G., Costantin, L., Langeroodi, D., et al. 2023b, ApJ, 951, L1 [CrossRef] [Google Scholar]
- Pérez-González, P. G., Rinaldi, P., Caputi, K. I., et al. 2024a, ApJ, 969, L10 [Google Scholar]
- Pérez-González, P. G., Barro, G., Rieke, G. H., et al. 2024b, ApJ, 968, 4 [CrossRef] [Google Scholar]
- Pérez-González, P. G., Östlin, G., Costantin, L., et al. 2025a, ApJ, 991, 179 [Google Scholar]
- Pérez-González, P. G., D’Eugenio, F., Rodríguez del Pino, B., et al. 2025b, Nat. Astron., 9, 1240 [Google Scholar]
- Rinaldi, P., Navarro-Carrera, R., Caputi, K. I., et al. 2025, ApJ, 981, 161 [Google Scholar]
- Roberts-Borsani, G., Treu, T., Shapley, A., et al. 2024, ApJ, 976, 193 [NASA ADS] [CrossRef] [Google Scholar]
- Roberts-Borsani, G., Oesch, P., Ellis, R., et al. 2025a, MNRAS, submitted [arXiv:2508.21708] [Google Scholar]
- Roberts-Borsani, G., Bagley, M., Rojas-Ruiz, S., et al. 2025b, ApJ, 983, 18 [Google Scholar]
- Robertson, B., Johnson, B. D., Tacchella, S., et al. 2024, ApJ, 970, 31 [NASA ADS] [CrossRef] [Google Scholar]
- Rodighiero, G., Bisigello, L., Iani, E., et al. 2023, MNRAS, 518, L19 [Google Scholar]
- Santini, P., Castellano, M., Merlin, E., et al. 2021, A&A, 652, A30 [NASA ADS] [CrossRef] [EDP Sciences] [Google Scholar]
- Santini, P., Fontana, A., Castellano, M., et al. 2023, ApJ, 942, L27 [NASA ADS] [CrossRef] [Google Scholar]
- Schaerer, D., & de Barros, S. 2009, A&A, 502, 423 [NASA ADS] [CrossRef] [EDP Sciences] [Google Scholar]
- Schreiber, C., Elbaz, D., Pannella, M., et al. 2017, A&A, 602, A96 [NASA ADS] [CrossRef] [EDP Sciences] [Google Scholar]
- Sersic, J. L. 1968, Atlas de Galaxias Australes (Cordoba, Argentina: Observatorio Astronomico) [Google Scholar]
- Sheth, R. K., & Tormen, G. 1999, MNRAS, 308, 119 [Google Scholar]
- Somerville, R. S., Yung, L. Y. A., Lancaster, L., et al. 2025, MNRAS, in press [arXiv:2505.05442] [Google Scholar]
- Stanway, E. R., & Eldridge, J. J. 2018, MNRAS, 479, 75 [NASA ADS] [CrossRef] [Google Scholar]
- Strait, V., Brammer, G., Muzzin, A., et al. 2023, ApJ, 949, L23 [NASA ADS] [CrossRef] [Google Scholar]
- Treu, T., Roberts-Borsani, G., Bradac, M., et al. 2022, ApJ, 935, 110 [NASA ADS] [CrossRef] [Google Scholar]
- Trinca, A., Schneider, R., Valiante, R., et al. 2024, MNRAS, 529, 3563 [NASA ADS] [CrossRef] [Google Scholar]
- Vulcani, B., Trenti, M., Calvi, V., et al. 2017, ApJ, 836, 239 [NASA ADS] [CrossRef] [Google Scholar]
- Weibel, A., de Graaff, A., Setton, D. J., et al. 2025a, ApJ, 983, 11 [Google Scholar]
- Weibel, A., Oesch, P. A., Williams, C. C., et al. 2025b, ApJ, submitted [arXiv:2507.06292] [Google Scholar]
- Westcott, L., Conselice, C. J., Harvey, T., et al. 2025, ApJ, 983, 121 [Google Scholar]
- Whitler, L., Stark, D. P., Topping, M. W., et al. 2025, ApJ, 992, 63 [Google Scholar]
- Williams, C. C., Curtis-Lake, E., Hainline, K. N., et al. 2018, ApJS, 236, 33 [CrossRef] [Google Scholar]
- Yan, H., Ma, Z., Ling, C., Cheng, C., & Huang, J.-S. 2023a, ApJ, 942, L9 [NASA ADS] [CrossRef] [Google Scholar]
- Yan, H., Sun, B., Ma, Z., Ling, C., et al. 2023b, ApJ submitted [arXiv:2311.15121] [Google Scholar]
- Yung, L. Y. A., Somerville, R. S., Nguyen, T., et al. 2024a, MNRAS, 530, 4868 [NASA ADS] [CrossRef] [Google Scholar]
- Yung, L. Y. A., Somerville, R. S., Finkelstein, S. L., Wilkins, S. M., & Gardner, J. P. 2024b, MNRAS, 527, 5929 [Google Scholar]
- Zavala, J. A., Buat, V., Casey, C. M., et al. 2023, ApJ, 943, L9 [NASA ADS] [CrossRef] [Google Scholar]
- Ziparo, F., Ferrara, A., Sommovigo, L., & Kohandel, M. 2023, MNRAS, 520, 2445 [NASA ADS] [CrossRef] [Google Scholar]
Appendix A: The extended samples of z ≳15 dropout candidates
We present the extended samples of z ∼15 − 20 (ID, coordinates and F356W magnitudes from M24 in Table A.1, SED, thumbnails and P(z) in Fig. A.1 and A.2) and z ∼20 − 28 (Table A.2, Fig. A.3 and A.4) candidates. We remark that while these objects also have colours and P(z) consistent with high-redshift solutions and are considered to be of interest for potential spectroscopic follow-up, the contamination level in these samples is expected to be significant (Sect. 3.1).
Extended sample of F200W dropout candidates in the ASTRODEEP-JWST fields
Extended sample of F277W dropout candidates in the ASTRODEEP-JWST fields
Appendix B: Spectral energy distributions of the confirmed interlopers
Main properties (Table B.1) and SEDs (Fig. B.1) of the six known interlopers of the F200W dropout selection. Objects COSMOS_31168, COSMOS_35731, COSMOS_76919 and UDS_56824 have been found at z ∼2-7 on the basis of NIRSpec observations carried out by the CAPERS survey (Sec. 4.3). Object A2744_27713 is a transient which is detectable in the second-epoch GLASS-JWST observations (November 2022) when its position was covered only by NIRCam LW bands.
Confirmed interlopers of the F200W dropout selectiona
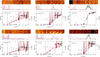 |
Fig. B.1. Same as Fig. 3, but for the confirmed interlopers of the F200W dropout selection. The best-fit templates of objects COSMOS_31168, COSMOS_35731, COSMOS_76919, and UDS_56824 shown in red were obtained with ZPHOT after fixing the redshift at the spectroscopic values (black dashed line in the P(z) panels). The E(B − V) range for COSMOS_35731, COSMOS_76919, and UDS_56824 has been constrained within the 1σ range indicated by the Balmer decrement. |
All Tables
All Figures
|
Fig. 1. Colour selection diagrams (left panels) for the selection of galaxies at z ∼ 15 − 20 (top) and z ∼ 20 − 30 (bottom). The cyan solid lines enclose the regions in which the reference sample to estimate the LFs are selected. The cyan dashed lines enclose regions where the additional extended samples are selected. The relevant redshift distributions of the selected reference (extended) samples are shown in the right panels as continuous (dashed) histograms. The points colour-coded according to the relevant redshift show objects from a mock generated over an area of 0.12 sq. deg., with low-redshift populations generated through the EGG software (Schreiber et al. 2017). Black stars show the position of brown dwarf models from Marley et al. (2021). All fluxes were perturbed with realistic noise properties to reproduce the typical depth of the JADES-GS field. Similar diagrams have been analysed for all fields using both the EGG- and JAGUAR-based simulations described in Sect. 1. |
| In the text | |
|
Fig. 2. Observed colour selection diagrams for LBGs at z ∼ 15 − 20 (left) and z ∼ 20 − 30 (right). The black continuous lines enclose the region, where ‘reference’ samples are selected. Large, filled markers show the position of the objects selected from the various fields, while the seven selected interlopers are shown as open symbols: CEERS-93316 (Arrabal Haro et al. 2023b), the transient A2744_27713, and the five objects observed with NIRSpec PRISM by the CAPERS survey (Sect. 4.3). Small markers show the position of candidates in the ‘extended’ samples selected within the colour region enclosed by dashed lines. Objects detected at S/N > 10 at any redshift in the JADES-GS field are shown as black points to highlight the parameter space where the bulk of ASTRODEEP-JWST objects are found. The coloured tracks mark the expected colours of stellar plus nebular BC03 templates at the different redshifts indicated by the relevant labels: high-redshift star-forming galaxies at z ≥ 10 with an age = 20 Myr, Z = 0.02 Z⊙, and E(B − V) = 0 (blue); passively evolving galaxies at 0 ≤ z ≤ 10 with Z = 0.2 Z⊙ formed with an instantaneous burst at z = 15 (dark red); dusty objects at 0 ≤ z ≤ 10 with an age = 100 Myr, Z = 0.2 Z⊙, and E(B − V) = 0.8 (dark green). |
| In the text | |
|
Fig. 3. Spectral energy distributions, P(z) and NIRCam thumbnails of the five F200W dropout candidates. For each object the best-fit templates at high and low redshift from the ZPHOT run are shown in blue and red, respectively. The relevant predicted magnitudes are indicated by blue empty squares and red empty hexagons, respectively. The photometric measurements are from M24, with black (magenta) circles and error-bars indicating JWST (HST) bands. The 2σ upper limits are shown as triangles. The P(z) from ZPHOT are shown as orange lines, the ones from EAZY adopting standard (standard plus Larson) templates are shown as continuous (dashed) light blue lines, the P(z) from BAGPIPES are shown in green with continuous, dashed and dotted lines respectively assuming a delayed, double power-law and exponential SFH, and the P(z) from CIGALE using a star-forming (star-forming+AGN) fit are shown as continuous (dashed) magenta lines. All curves are normalised to have P(z) = 1 at the peak. The 1.2 × 1.2 arcsec thumbnails, from left to right, respectively, show the objects in the F090W (where available), F115W, F150W, F200W, F277W, F356W, F410M, and F444W bands used for the ASTRODEEP-JWST measurements. |
| In the text | |
|
Fig. 4. Average redshift probability distribution functions, P(z), for objects in the extended samples of F200W dropouts (left) and F277W dropouts (right) computed with ZPHOT, EAZY, BAGPIPES, and CIGALE (same colour conventions as in Fig. 3). The curves are normalised to have P(z) = 1 at the peak. |
| In the text | |
|
Fig. 5. Top: Position in the E(B − V) vs Mstar plane of galaxy templates (points colour-coded according to the redshift) that provide an acceptable fit with probability P(z) > 0.5 to the F200W dropout candidates. The regions occupied by the 90% to 10%, at 10% steps, of the aforementioned templates are enclosed by dotted curves. The continuous curves enclose the regions occupied by the 90% to 10%, at 10% steps, of the objects in the same redshift range from the JADES-GS field. The black square and error-bars mark the positions of the confirmed interlopers. Bottom: Same as top panel for low-redshift solutions at 2 ≤ z ≤ 8 in the sSFR vs E(B − V) plane, colour-coded according to the stellar age. |
| In the text | |
|
Fig. 6. Observed 2D (top) and 1D (bottom) NIRSpec PRISM spectra of the five interlopers observed by the CAPERS survey. Bottom panels: Noise RMS shown as the gray dashed line, while the red dashed lines highlight the wavelength of the detected features. The best-fit template obtained by fitting the CEERS_15937 spectrum with BAGPIPES is shown in yellow in the relevant panel. The inset in the UDS_56824 panel shows the 3 × 3 arcsec ALMA Band 7 map centred at the position of the object (black square), with the relevant beam size shown on the lower-left corner. |
| In the text | |
|
Fig. 7. UV LFs at 15 ≤ z ≤ 20 based on the F200W-dropout selection of the ASTRODEEP-JWST catalogues, compared to results from the literature by Harikane et al. (2025), Donnan et al. (2024), Robertson et al. (2024), Casey et al. (2024), Finkelstein et al. (2024), Whitler et al. (2025), Kokorev et al. (2025), Weibel et al. (2025b) (see label for details). The UV LF at 15 ≤ z ≤ 20 is shown for the two scenarios discussed in Sect. 5: assuming that all candidates are at z > 15 (case 1: black circles and error-bars) or that they are all interlopers (case 2: red squares and 1-σ upper limits). |
| In the text | |
|
Fig. 8. 1-σ upper limits on the UV LFs at 20 ≤ z ≤ 28 based on the non-detection of F277W-dropout candidates in the ASTRODEEP-JWST catalogues, compared to binned and Schechter estimates at z = 25 by Pérez-González et al. (2025a). |
| In the text | |
|
Fig. 9. Comparison between the UV LF at 15 ≤ z ≤ 20 (symbols as in Fig. 7) and two empirical models at different redshifts as indicated by the relevant labels: (a) model based on the Sheth & Tormen (1999) HMF and the LUV/MH at z = 5 by Mason et al. (2015) brightened by one magnitude to match the z ∼ 12.5 UV LF; (b) model maximising the abundance of high-redshift galaxies (see Sect. 5.2). In both panels are included for reference the binned LFs measured by Donnan et al. (2024) (z = 12.5), Whitler et al. (2025) (z = 16), Kokorev et al. (2025) (z = 18), and Pérez-González et al. (2025a) (z = 17 and z = 25), with symbol meanings as in Fig. 7. |
| In the text | |
|
Fig. 10. Same as Fig. 9 for self-consistent theoretical models: (c) attenuation-free model (Ferrara et al. 2023, 2025b; Ziparo et al. 2023; d) feedback-free model with ϵ = 0.3 (shaded region encloses predictions for 0.2 ≤ ϵ ≤ 0.5 at z = 15) (Dekel et al. 2023; Li et al. 2024; e) DELPHI fiducial (blue), eSFE (green), and eIMF (orange) models by Mauerhofer et al. (2025); (f) CAT models (Trinca et al. 2024) with standard (magenta) and evolving IMF (orange); (g) Santa Cruz SAM (Somerville et al. 2025), with dense gas fraction fdense = 0.1, 0.5, 1. |
| In the text | |
|
Fig. 11. Area at which at least one object brighter than MUV at 15 ≤ z ≤ 20 is expected according to the following theoretical predictions (see label for details): Attenuation-free model (Ferrara et al. 2023, 2025b; Ziparo et al. 2023); feedback-free model with ϵ = 0.3 and with ϵ = 0.5 (Dekel et al. 2023; Li et al. 2024); DELPHI fiducial, eSFE and eIMF models by Mauerhofer et al. (2025); CAT models (Trinca et al. 2024) with standard and evolving IMF; Santa Cruz SAM (Somerville et al. 2025), with dense gas fraction fdense = 0.1, 0.5, 1; empirical fine-tuned M/L model (see Sect. 5.2). The top axis shows the corresponding observed continuum magnitude (at rest-frame wavelength λrf = 1500 Å) assuming z = 17. The dash-dotted cyan line shows the Nobj = 1 area versus MUV for the empirical fine-tuned M/L model at 20 ≤ z ≤ 30: the relevant observed magnitude at z = 25 is fainter by 0.52 mag than the scale shown on top. |
| In the text | |
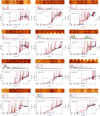 |
Fig. A.1. Same as Fig. 3, but for the extended sample of F200W dropouts (part 1). |
| In the text | |
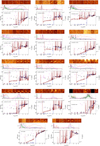 |
Fig. A.2. Same as Fig. 3, but for the extended sample of F200W dropouts (part 2). |
| In the text | |
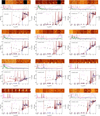 |
Fig. A.3. Same as Fig. 3, but for the extended sample of F277W dropouts (part 1). |
| In the text | |
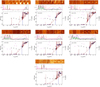 |
Fig. A.4. Same as Fig. 3, but for the extended sample of F277W dropouts (part 2). |
| In the text | |
|
Fig. B.1. Same as Fig. 3, but for the confirmed interlopers of the F200W dropout selection. The best-fit templates of objects COSMOS_31168, COSMOS_35731, COSMOS_76919, and UDS_56824 shown in red were obtained with ZPHOT after fixing the redshift at the spectroscopic values (black dashed line in the P(z) panels). The E(B − V) range for COSMOS_35731, COSMOS_76919, and UDS_56824 has been constrained within the 1σ range indicated by the Balmer decrement. |
| In the text | |
Current usage metrics show cumulative count of Article Views (full-text article views including HTML views, PDF and ePub downloads, according to the available data) and Abstracts Views on Vision4Press platform.
Data correspond to usage on the plateform after 2015. The current usage metrics is available 48-96 hours after online publication and is updated daily on week days.
Initial download of the metrics may take a while.