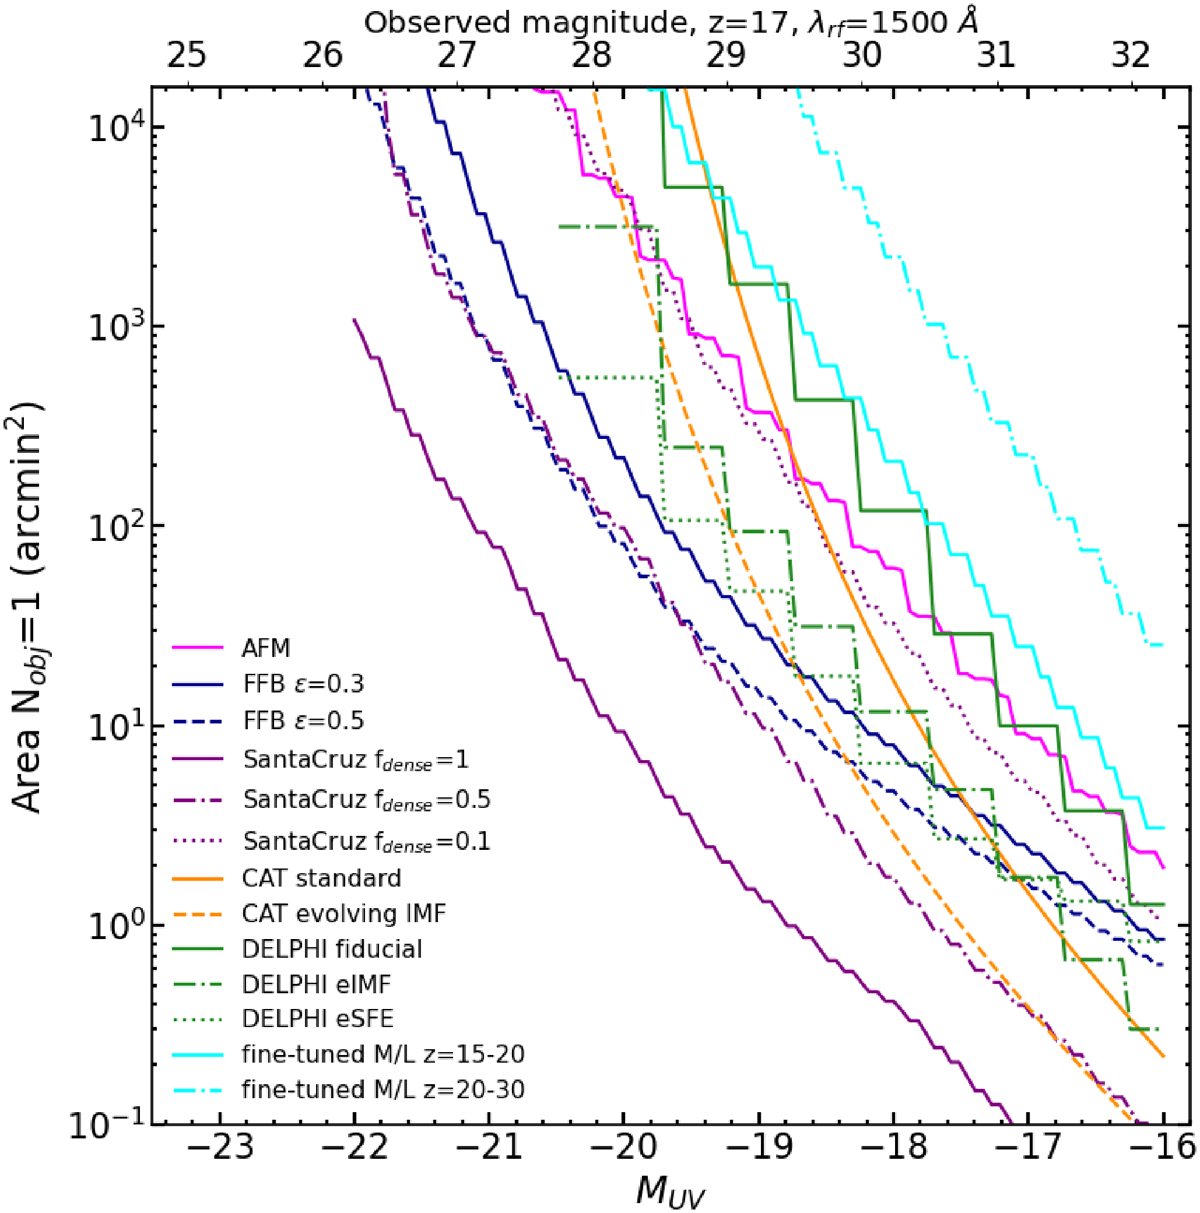
Fig. 11.
Download original image
Area at which at least one object brighter than MUV at 15 ≤ z ≤ 20 is expected according to the following theoretical predictions (see label for details): Attenuation-free model (Ferrara et al. 2023, 2025b; Ziparo et al. 2023); feedback-free model with ϵ = 0.3 and with ϵ = 0.5 (Dekel et al. 2023; Li et al. 2024); DELPHI fiducial, eSFE and eIMF models by Mauerhofer et al. (2025); CAT models (Trinca et al. 2024) with standard and evolving IMF; Santa Cruz SAM (Somerville et al. 2025), with dense gas fraction fdense = 0.1, 0.5, 1; empirical fine-tuned M/L model (see Sect. 5.2). The top axis shows the corresponding observed continuum magnitude (at rest-frame wavelength λrf = 1500 Å) assuming z = 17. The dash-dotted cyan line shows the Nobj = 1 area versus MUV for the empirical fine-tuned M/L model at 20 ≤ z ≤ 30: the relevant observed magnitude at z = 25 is fainter by 0.52 mag than the scale shown on top.
Current usage metrics show cumulative count of Article Views (full-text article views including HTML views, PDF and ePub downloads, according to the available data) and Abstracts Views on Vision4Press platform.
Data correspond to usage on the plateform after 2015. The current usage metrics is available 48-96 hours after online publication and is updated daily on week days.
Initial download of the metrics may take a while.