Fig. 3.
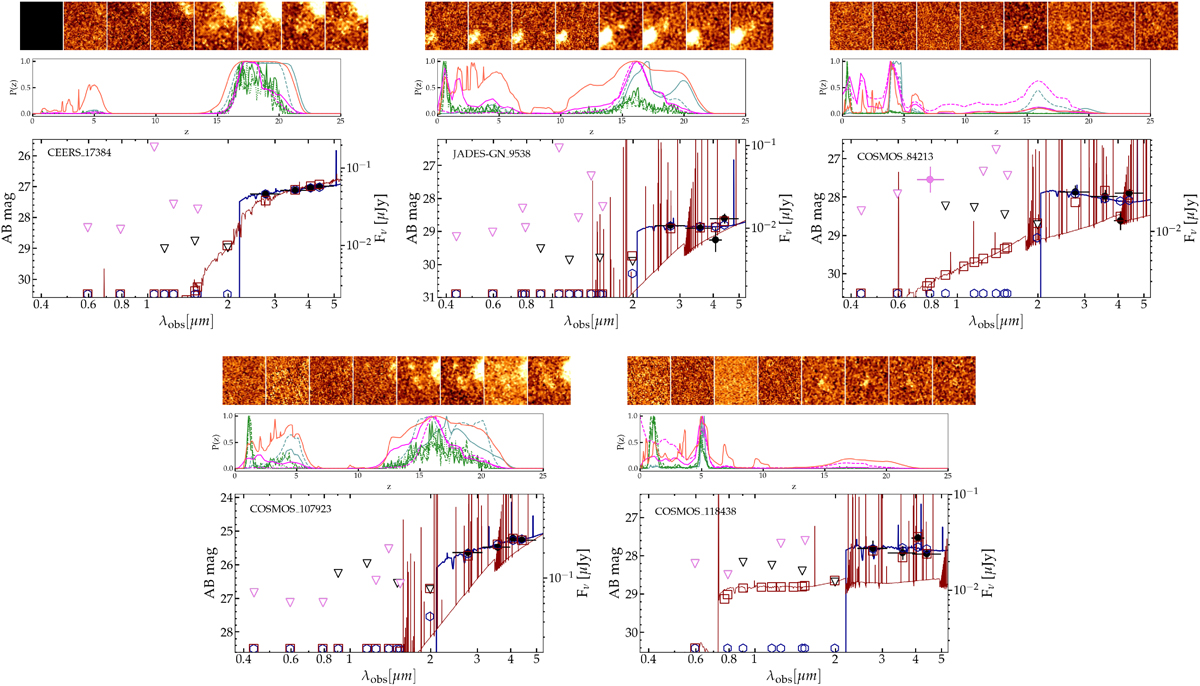
Download original image
Spectral energy distributions, P(z) and NIRCam thumbnails of the five F200W dropout candidates. For each object the best-fit templates at high and low redshift from the ZPHOT run are shown in blue and red, respectively. The relevant predicted magnitudes are indicated by blue empty squares and red empty hexagons, respectively. The photometric measurements are from M24, with black (magenta) circles and error-bars indicating JWST (HST) bands. The 2σ upper limits are shown as triangles. The P(z) from ZPHOT are shown as orange lines, the ones from EAZY adopting standard (standard plus Larson) templates are shown as continuous (dashed) light blue lines, the P(z) from BAGPIPES are shown in green with continuous, dashed and dotted lines respectively assuming a delayed, double power-law and exponential SFH, and the P(z) from CIGALE using a star-forming (star-forming+AGN) fit are shown as continuous (dashed) magenta lines. All curves are normalised to have P(z) = 1 at the peak. The 1.2 × 1.2 arcsec thumbnails, from left to right, respectively, show the objects in the F090W (where available), F115W, F150W, F200W, F277W, F356W, F410M, and F444W bands used for the ASTRODEEP-JWST measurements.
Current usage metrics show cumulative count of Article Views (full-text article views including HTML views, PDF and ePub downloads, according to the available data) and Abstracts Views on Vision4Press platform.
Data correspond to usage on the plateform after 2015. The current usage metrics is available 48-96 hours after online publication and is updated daily on week days.
Initial download of the metrics may take a while.