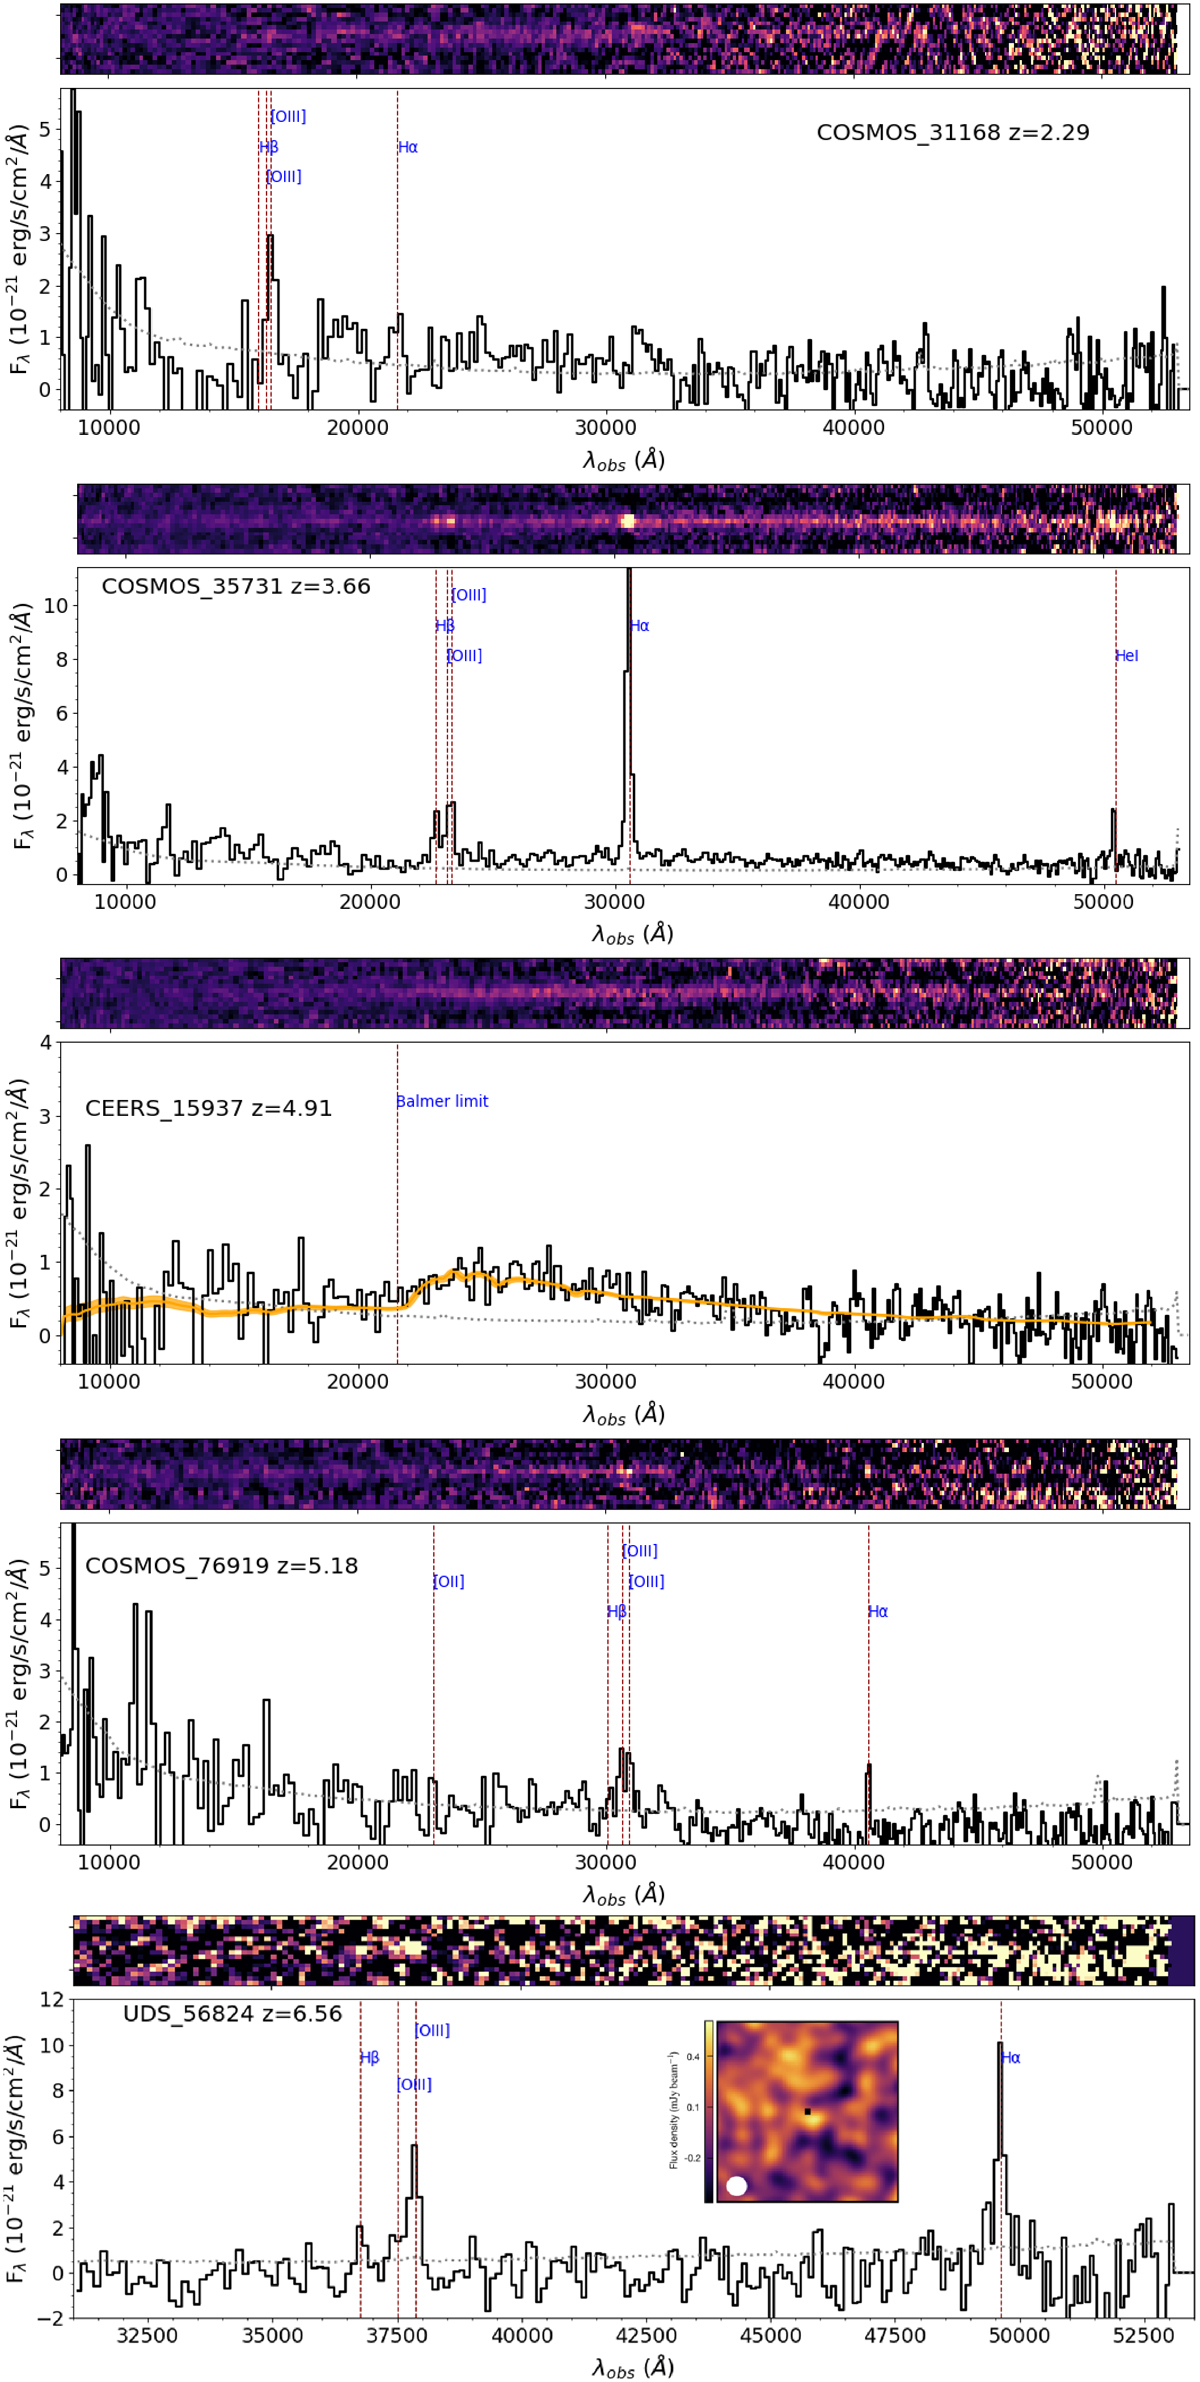
Fig. 6.
Download original image
Observed 2D (top) and 1D (bottom) NIRSpec PRISM spectra of the five interlopers observed by the CAPERS survey. Bottom panels: Noise RMS shown as the gray dashed line, while the red dashed lines highlight the wavelength of the detected features. The best-fit template obtained by fitting the CEERS_15937 spectrum with BAGPIPES is shown in yellow in the relevant panel. The inset in the UDS_56824 panel shows the 3 × 3 arcsec ALMA Band 7 map centred at the position of the object (black square), with the relevant beam size shown on the lower-left corner.
Current usage metrics show cumulative count of Article Views (full-text article views including HTML views, PDF and ePub downloads, according to the available data) and Abstracts Views on Vision4Press platform.
Data correspond to usage on the plateform after 2015. The current usage metrics is available 48-96 hours after online publication and is updated daily on week days.
Initial download of the metrics may take a while.