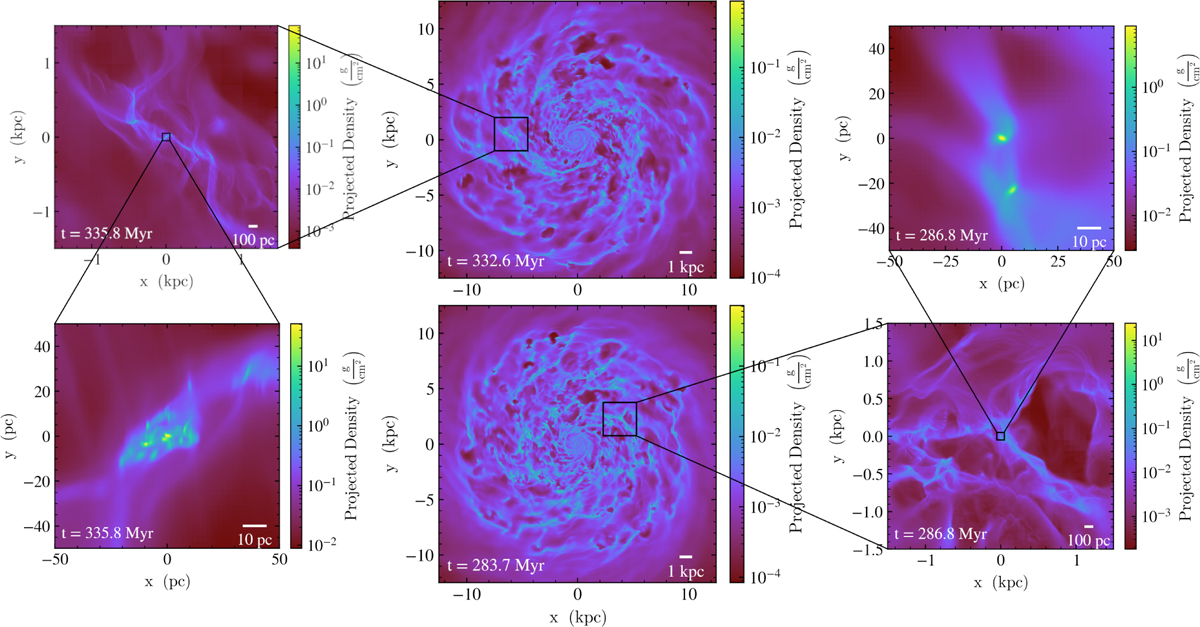
Fig. 1
Download original image
Galaxy overview from Zhao et al. (2024). The central panels show the two snapshots of the galaxy we used, the top panel shows the location of the region with less feedback (quiet), and the bottom panel shows the location of the feedback-dominated region (active). The first zoom-in panels show the regions down to a few kiloparsec (top left and bottom right panels), followed by the close-ups of the regions in 100 × 100 pc boxes (bottom left and top right panels).
Current usage metrics show cumulative count of Article Views (full-text article views including HTML views, PDF and ePub downloads, according to the available data) and Abstracts Views on Vision4Press platform.
Data correspond to usage on the plateform after 2015. The current usage metrics is available 48-96 hours after online publication and is updated daily on week days.
Initial download of the metrics may take a while.