Fig. 13
Download original image
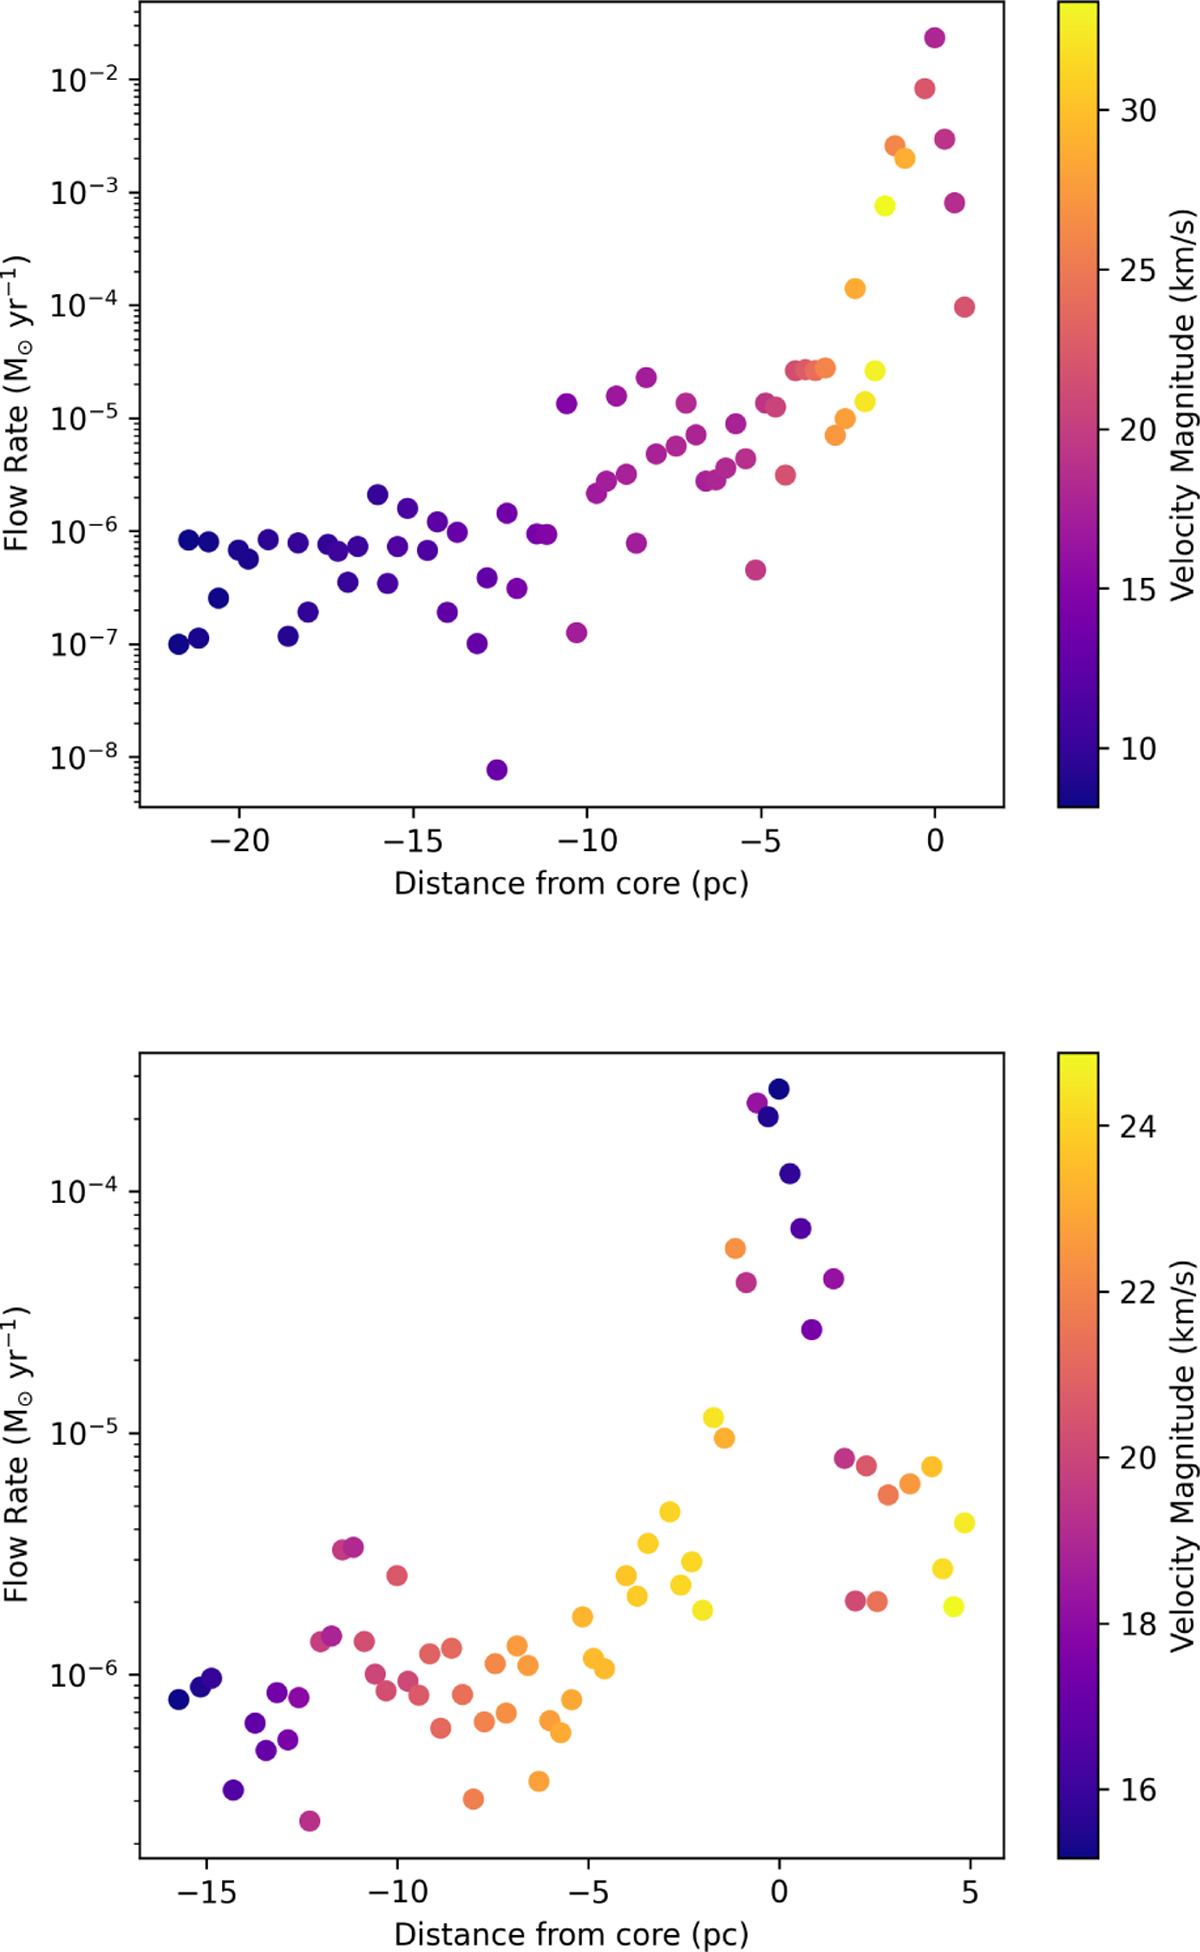
Flow rates along the filaments in the active cube. The colour bar represents the velocity magnitude at that point. Top: 3D filament corresponding to filament 1 in Figure 3a. It feeds the central massive clump. Bottom: 3D filament representing filament 3 in Figure 3a. It feeds the non-central clump. Negative values represent positions leftwards of the clump, i.e., lower values of x and y. On the x-axis, 0 corresponds to the clump position.
Current usage metrics show cumulative count of Article Views (full-text article views including HTML views, PDF and ePub downloads, according to the available data) and Abstracts Views on Vision4Press platform.
Data correspond to usage on the plateform after 2015. The current usage metrics is available 48-96 hours after online publication and is updated daily on week days.
Initial download of the metrics may take a while.