Fig. 14
Download original image
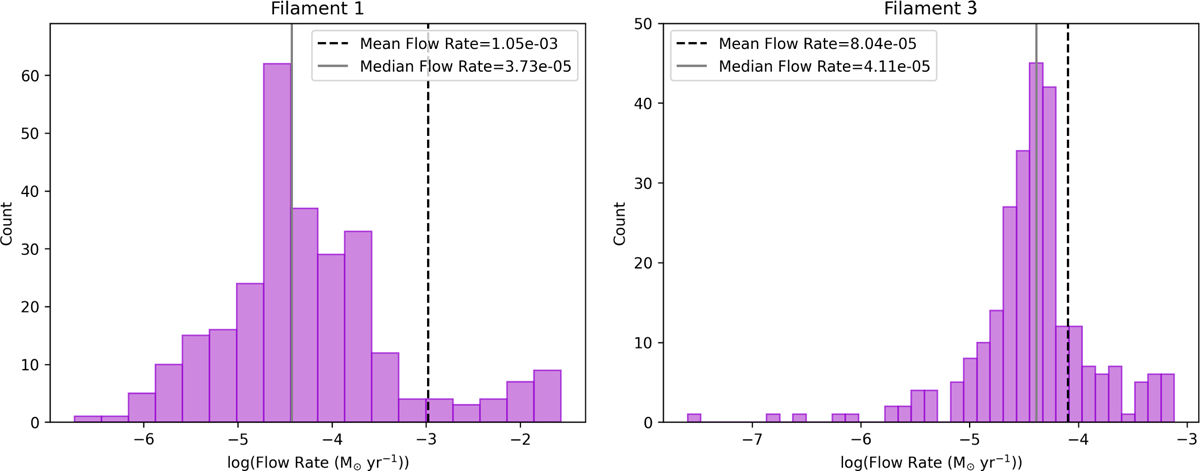
Distributions of all the perpendicular flow rates measured at 0, π/2, π, and 3π/2 for the 3D filament spines in the active region. The dashed black and solid grey lines sit at the mean and median flow rate values, respectively, and the numbers are shown in the legend. Left: filament 1, which feeds the central massive clump. Right: filament 3, which feeds the non-central clump.
Current usage metrics show cumulative count of Article Views (full-text article views including HTML views, PDF and ePub downloads, according to the available data) and Abstracts Views on Vision4Press platform.
Data correspond to usage on the plateform after 2015. The current usage metrics is available 48-96 hours after online publication and is updated daily on week days.
Initial download of the metrics may take a while.