Fig. 4
Download original image
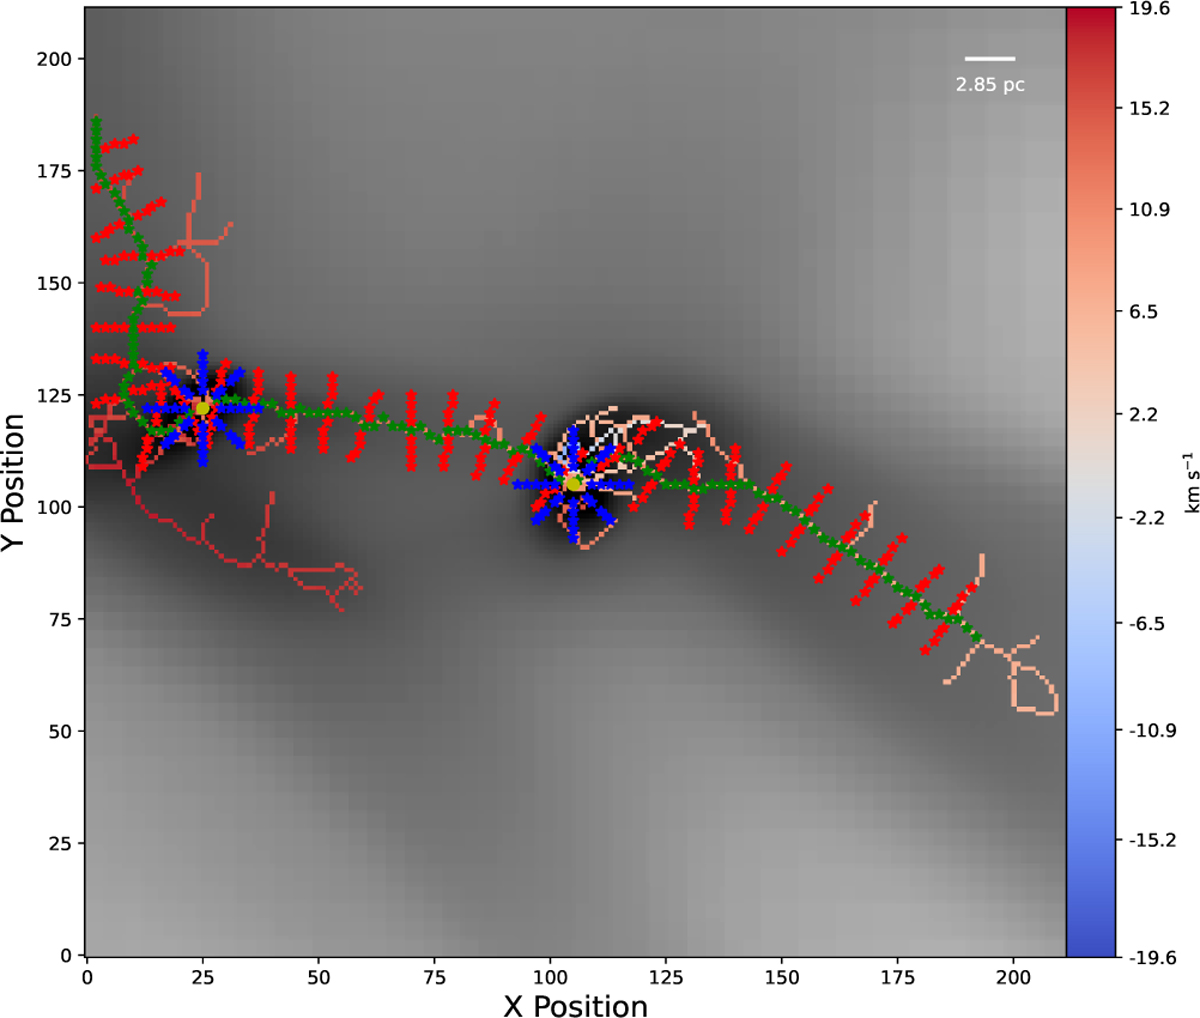
Zeroth-moment map of the active column density cube with the identified filamentary structure, colour-coded by velocity, is overlaid. The green, red, and blue points indicate the different types of the flow rate. Green is along the filamentary structure, red is onto, and blue is polar around the clumps. The 2.85 pc scale bar is shown in the top right corner.
Current usage metrics show cumulative count of Article Views (full-text article views including HTML views, PDF and ePub downloads, according to the available data) and Abstracts Views on Vision4Press platform.
Data correspond to usage on the plateform after 2015. The current usage metrics is available 48-96 hours after online publication and is updated daily on week days.
Initial download of the metrics may take a while.