Fig. 9
Download original image
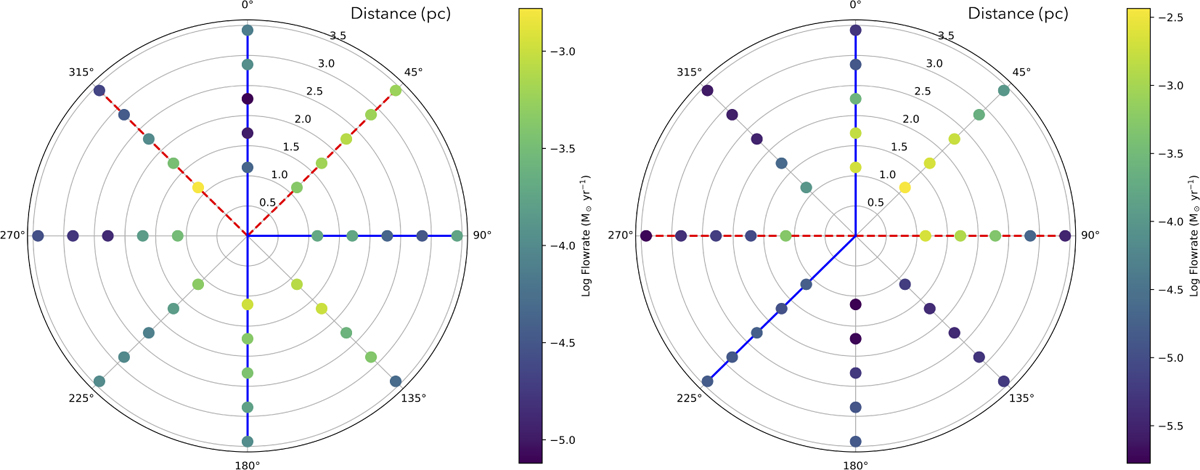
Relation of radial distance to the flow rate for eight different angles around each clump in the active region. Numbers from 0.5 to 3.5 represent the distance from the centre for each of the concentric circles in pc. The dashed red lines indicate the primary filaments, and the solid blue lines indicate the directions of the feeder filaments.
Current usage metrics show cumulative count of Article Views (full-text article views including HTML views, PDF and ePub downloads, according to the available data) and Abstracts Views on Vision4Press platform.
Data correspond to usage on the plateform after 2015. The current usage metrics is available 48-96 hours after online publication and is updated daily on week days.
Initial download of the metrics may take a while.