Fig. 12.
Download original image
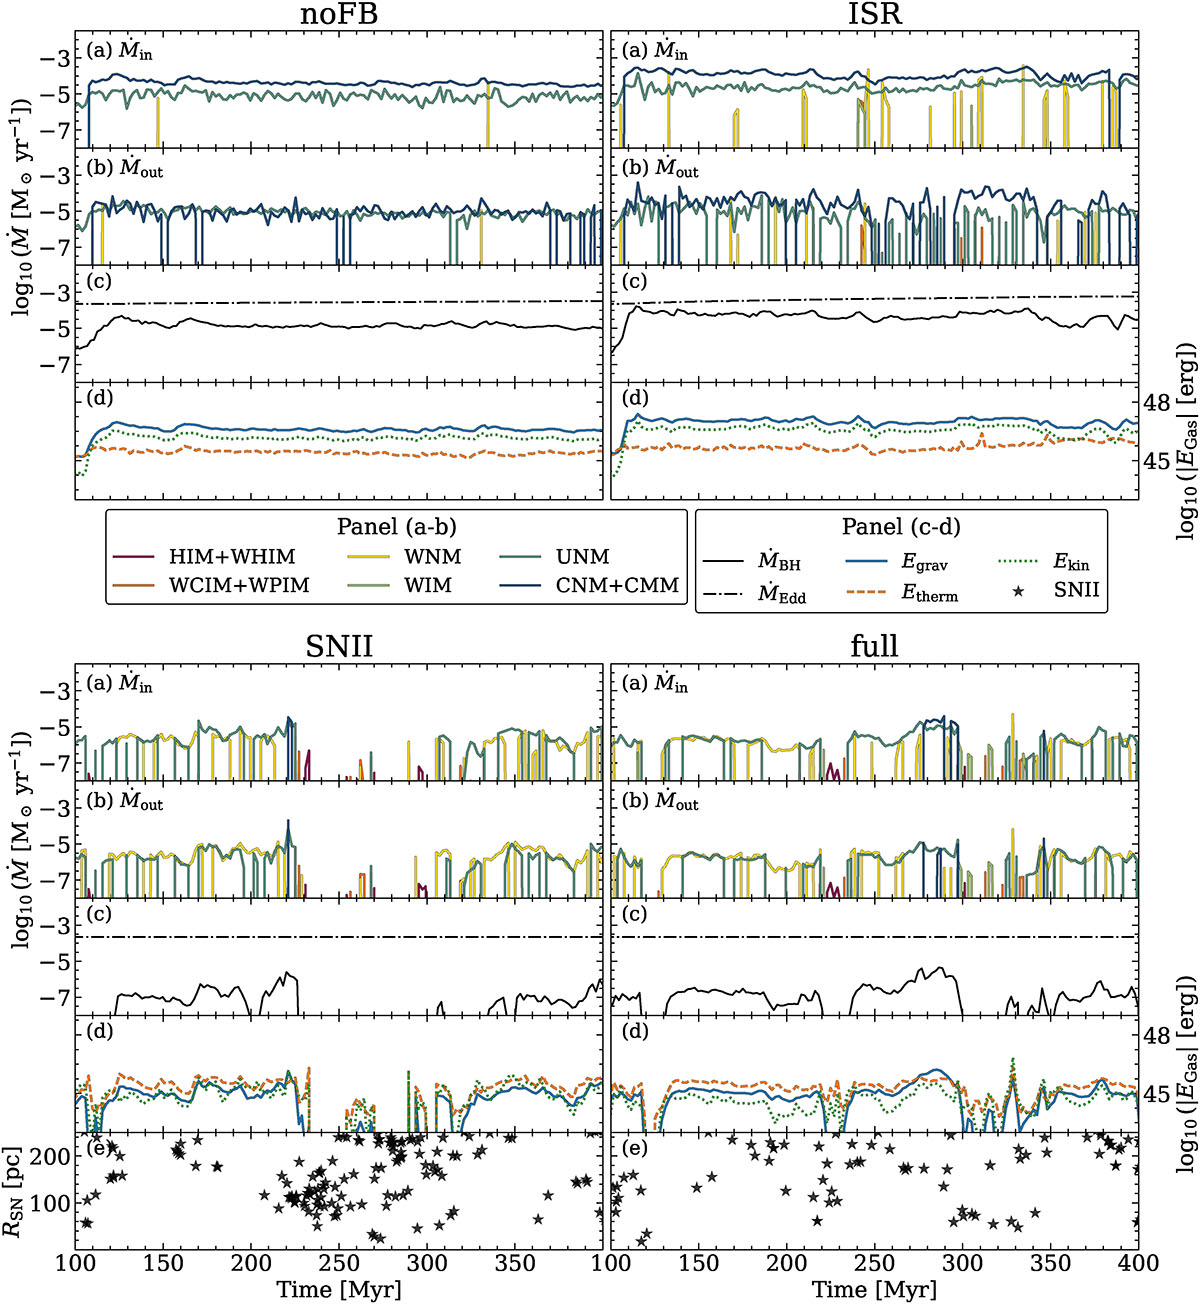
Panels (a)–(b): Cut-out of the time evolution (between 100 and 400 Myr) for the gas inflow (panel a) and outflow (panel b) rate at the vicinity of the MBH (through a spherical shell at R = [1, 3] pc) for different ISM phases (coloured lines), in our Stellar Feedback simulations (see Table 2). Panel (c): Corresponding time evolution of the MBH gas accretion rate and its Eddington accretion limit (solid and dash-dotted black line, respectively). Panel (d): As a function of time, the total gravitational binding- (solid blue line), thermal- (dashed orange line), and kinetic energy (dotted green line) of all the inflowing and outflowing gas between R = [1, 3] pc. Panel (e): Radial distances (with respect to the position of the MBH) to nearby SNII explosions as a function of time.
Current usage metrics show cumulative count of Article Views (full-text article views including HTML views, PDF and ePub downloads, according to the available data) and Abstracts Views on Vision4Press platform.
Data correspond to usage on the plateform after 2015. The current usage metrics is available 48-96 hours after online publication and is updated daily on week days.
Initial download of the metrics may take a while.