| Issue |
A&A
Volume 704, December 2025
|
|
|---|---|---|
| Article Number | A177 | |
| Number of page(s) | 25 | |
| Section | Extragalactic astronomy | |
| DOI | https://doi.org/10.1051/0004-6361/202555130 | |
| Published online | 09 December 2025 | |
NOCTUA suite of simulations
The difficulty of growing massive black holes in low-mass dwarf galaxies
1
Institute of Physics, Laboratory for Galaxy Evolution and Spectral Modelling, Ecole Polytechnique Fédérale de Lausanne, Observatoire de Sauverny, Chemin Pegasi 51, CH-1290 Versoix, Switzerland
2
Universität Heidelberg, Zentrum für Astronomie, Institut für Theoretische Astrophysik, Albert-Ueberle-Str. 2, 69120 Heidelberg, Germany
3
Universität Heidelberg, Interdisziplinäres Zentrum für Wissenschaftliches Rechnen, Im Neuenheimer Feld 205, D-69120 Heidelberg, Germany
4
Harvard-Smithsonian Center for Astrophysics, 60 Garden Street, Cambridge, MA 02138, USA
5
Elizabeth S. and Richard M. Cashin Fellow at the Radcliffe Institute for Advanced Studies at Harvard University, 10 Garden Street, Cambridge, MA 02138, USA
6
Max Planck Institute for Astrophysik, Karl-Schwarzschild-Str. 1, 85748 Garching, Germany
7
Center for Computational Astrophysics, Flatiron Institute, 162 5th Avenue, New York, NY 10010, USA
8
Centre de Recherche Astrophysique de Lyon UMR5574, ENS de Lyon, Univ. Lyon1, CNRS, Université de Lyon, 69007 Lyon, France
★ Corresponding author: This email address is being protected from spambots. You need JavaScript enabled to view it.
Received:
11
April
2025
Accepted:
6
October
2025
Abstract
Aims. We study the individual and cumulative impact of stellar feedback on massive black hole (MBH) growth in a simulated low-mass dwarf galaxy. Furthermore, we explore the influence of the MBH’s initial mass (103−6 M⊙) on the gas accretion, and whether or not artificially induced gas inflows can ‘boost’ further gas accretion onto the MBH.
Methods. A suite of high-resolution radiation-hydrodynamic simulations called NOCTUA were performed, using the AREPONOCTUA numerical framework. The chemical evolution of the interstellar medium (ISM) was modelled in a time-dependent non-equilibrium way. Two types of stellar feedback were considered: individually traced type II supernova (SNII) explosions, and radiatively transferred (on-the-fly) ionising stellar radiation (ISR) from OB stars. As part of AREPONOCTUA, we develop and apply a novel physically motivated model for MBH gas accretion, taking into account the angular momentum of the gas in the radiatively efficient regime, to estimate the gas accretion rate onto the MBH from its sub-grid accretion disc.
Results. Without any stellar feedback, an initial 104 M⊙ MBH is able to steadily grow over time, roughly doubling its mass after 800 Myr. Surprisingly, the growth of the MBH more than doubles when only ISR feedback is considered, compared to the no stellar feedback run. This is due to the star formation rate (SFR) being highly suppressed (to a similar level or slightly above that when SNII feedback is considered), enabling a higher cumulative net gas inflow onto the MBH from not only the cold neutral and molecular medium phases, but also the unstable and warm neutral medium phases of the ISM. With SNII feedback included, the gas accretion onto the MBH is episodic over time, and is already suppressed by more than an order of magnitude during the first 150 Myr. When combining SNII with ISR feedback, the growth of the MBH remains suppressed due to SNII explosions, but to a lesser extent compared to the SNII-only feedback run, due to a slightly lower SFR, and thus a reduced number of SNII events.
Conclusions. We conclude that SNII feedback is a strong regulator and suppressor of MBH growth, and that only an initial 105 M⊙ MBH is able to consistently accrete gas in the radiatively efficient regime (in the presence of SNII feedback). Combined with the fact that artificially induced gas inflows are unable to boost further gas accretion onto the MBH (even for an initial 106 M⊙ MBH), this suggests that it is primarily the nearby gravitational potential around the MBH that determines how much the MBH can grow via gas accretion over time (at least in an isolated non-cosmological environment).
Key words: black hole physics / methods: numerical / galaxies: dwarf / galaxies: ISM / galaxies: star formation
© The Authors 2025
 Open Access article, published by EDP Sciences, under the terms of the Creative Commons Attribution License (https://creativecommons.org/licenses/by/4.0), which permits unrestricted use, distribution, and reproduction in any medium, provided the original work is properly cited.
This article is published in open access under the Subscribe to Open model. This email address is being protected from spambots. You need JavaScript enabled to view it. to support open access publication.
1. Introduction
The stellar mass, luminosity, and velocity dispersion of a galaxy’s spheroidal component are repeatedly inferred to strongly correlate with the mass of its residing central black hole (BH). These scaling relations are observed for supermassive BHs (SMBHs) of MBH ≳ 106 M⊙ (Silk & Rees 1998; Magorrian et al. 1998; Tremaine et al. 2002; King 2003; Häring & Rix 2004; Graham & Driver 2007; Gültekin et al. 2009; McConnell & Ma 2013), but also recently in the high-end intermediate-mass BH (IMBH) regime of MBH ∼ 104−6 M⊙ (see e.g. Reines & Volonteri 2015; Schutte et al. 2019). As these massive BHs (MBHs) grow via gas accretion, substantial amounts of energy are expected to be released into the surrounding medium, enough to power active galactic nuclei (AGNs) and (in extreme cases) luminous quasars (Salpeter 1964; Lynden-Bell 1969). This so-called AGN feedback (composed of radiation, winds, and jets) is thought to be able to regulate both the gas inflow and the amount of star formation in host galaxies, and thus be responsible for their observed co-evolution with the central BH (at least in the SMBH regime; see e.g. Fabian 2012; Kormendy & Ho 2013) – even though non-causal origins for scaling relations have been discussed as well (Hirschmann et al. 2010; Jahnke & Macciò 2011).
Numerical cosmological simulations provide a robust theoretical framework to study MBH accretion and AGN feedback in a galaxy evolution context (e.g. Di Matteo et al. 2008; Hirschmann et al. 2014; Choi et al. 2015; Schaye et al. 2015; Sijacki et al. 2015; Somerville & Davé 2015; Volonteri et al. 2016; Naab & Ostriker 2017; Nelson et al. 2019), and have been proven to be successful when it comes to, for example, recreating many of the observed local scaling relations. However, as was recently illustrated by Habouzit et al. (2022), these large-scale cosmological simulations struggle to produce a consensus in the low-mass galaxy regime at high redshift (z ≥ 4), and instead predict a wide range of MBH and AGN properties at a fixed host galaxy stellar mass, M★. This discrepancy is ultimately due to the various (often ad hoc) sub-grid models implemented for MBH seeding, accretion and AGN feedback (as a consequence of the limited spatial resolution). Furthermore, the physical modelling of galaxies’ internal processes (e.g. stellar feedback) is thought to be able to strongly alter the time evolution and shape of the MBH − M★ relation, especially in the lower stellar mass range, M★ ≤ 1010.5 M⊙ (Habouzit et al. 2021). With the increasing number of active MBH candidates at high redshift over the last decade (see e.g. Willott et al. 2009, 2010; Mortlock et al. 2009, 2011; Kim et al. 2015; Jiang et al. 2016; Reed et al. 2017, 2019; Matsuoka et al. 2016, 2018, 2019; Andika et al. 2020; Yang et al. 2020; Wang et al. 2021; Gloudemans et al. 2022; Bañados et al. 2023), accelerated by the advent of the James Webb Space Telescope (see e.g. Harikane et al. 2023; Kocevski et al. 2023; Kokorev et al. 2023; Larson et al. 2023; Onoue et al. 2023; Greene et al. 2024; Lin et al. 2024; Maiolino et al. 2024; Matthee et al. 2024; Taylor et al. 2025), the need for detailed theoretical models of MBH growth, in particular via gas accretion, is more pressing than ever.
In parallel, the number of lower-mass MBH candidates at 104 < MBH < 106 M⊙ in (typically low-metallicity) dwarf galaxies at low to intermediate redshifts has steadily increased as well (see e.g. Moran et al. 2014; Pardo et al. 2016; Nguyen et al. 2019; Baldassare et al. 2017, 2018, 2020; Mezcua & Domínguez Sánchez 2020; Reines et al. 2011, 2013, 2020; Mezcua et al. 2018, 2019, 2023; Übler et al. 2023; Sacchi et al. 2024), suggesting that the dwarf galaxy regime might serve as a plausible channel for early MBH growth, provided that MBHs in local dwarf galaxies are leftovers from high redshift (which is still debated; see e.g. Mezcua 2019). However, the extent to which lower-mass MBHs can grow in mass when residing in this type of environment is unclear at the moment. While some theoretical studies suggest that early MBH growth is largely suppressed by strong supernova feedback at high redshift (Dubois et al. 2015; Habouzit et al. 2017; Prieto et al. 2017; McAlpine et al. 2018; Trebitsch et al. 2018), others argue that low-mass MBHs can indeed grow at a high enough rate to even invoke AGN feedback (Barai & de Gouveia Dal Pino 2019; Sharma et al. 2020, 2022; Koudmani et al. 2019, 2021, 2022, but typically at slightly lower redshifts). Still, despite the high spatial resolution achievable in some of these works, many of them still rely on the same physical models (or slightly modified ones) for BH physics and stellar feedback employed in large-scale cosmological simulations (see above).
Accurate modelling of MBH gas accretion is vital, because apart from governing the growth of the MBH itself, it also essentially determines the strength of the AGN feedback. Most large-scale (or zoom-in) cosmological simulations adopt a Bondi-Hoyle-Lyttleton formalism (Hoyle & Lyttleton 1939; Bondi & Hoyle 1944; Bondi 1952), assuming a homogeneous spherically symmetric steady gas accretion flow (of zero angular momentum). However, this is far from always applicable to a galactic environment, in which the interstellar medium (ISM) is expected to be turbulent and composed of multi-phase gas (see e.g. Bellovary et al. 2013; Gaspari et al. 2013; Klessen & Glover 2016). Additionally, the characteristic length scale of Bondi-Hoyle-Lyttleton accretion is often not even resolved in state-of-the-art cosmological simulations. To account for this, many numerical models introduce a constant boost factor, α, to ‘boost’ the estimated accretion rate (see e.g. Springel et al. 2005), with the motivation that at large radii, the density and temperature are under- and over-estimated, respectively (due to an over-pressurised ISM), meaning that the Bondi-Hoyle-Lyttleton accretion rate is overall under-estimated (with exceptions, e.g. Weinberger et al. 2018). The value of α is, however, very uncertain, and can range over several orders of magnitude (Booth & Schaye 2009). There are also large uncertainties in the numerical implementation of Bondi-Hoyle-Lyttleton accretion. Negri & Volonteri (2017) find, for example, that differences in the spatial resolution of the simulation, and how the variables needed to estimate the accretion rate are computed, can lead to both over- and under-estimated MBH growth. That said, we note that many studies try to get around these shortcomings by either modifying already existing Bondi-Hoyle-Lyttleton accretion schemes (see e.g. Rosas-Guevara et al. 2015; Steinborn et al. 2015), or by developing their own BH accretion models; for instance, by the use of gravitational torques (Anglés-Alcázar et al. 2015) or by utilising a Bayesian forward-modelling approach (Weinberger et al. 2025).
In order to more accurately model MBH gas accretion, while simultaneously modelling galaxies’ internal processes in a physically motivated way, a high spatial resolution is required. For this purpose, idealised galaxy simulations make a great case, thanks to the possibility of constructing well-controlled initial conditions, and of running simulations at a relatively low computational cost. Sivasankaran et al. (2022) recently demonstrated using a set of idealised Milky Way- to Small Magellanic Cloud-like simulations that MBH gas accretion can significantly alter and become highly variable over time when an explicit treatment of the ISM is considered (compared to an effective equation of state; e.g. Springel & Hernquist 2003). Likewise, idealised dwarf galaxy simulations have opened up new possibilities, allowing us to study in great detail the individual and cumulative impact of various physical processes important for galaxy evolution, and the influence they may have in shaping the overall global and local properties of dwarf galaxies (Hu et al. 2016, 2017; Emerick et al. 2019; Agertz et al. 2020; Lahén et al. 2020; Gutcke et al. 2021; Smith et al. 2021; Whitworth et al. 2022, 2023; Andersson et al. 2023; Deng et al. 2024; Steinwandel et al. 2024). Yet, so far only Partmann et al. (2025) have applied this type of numerical framework to study MBH accretion in the dwarf galaxy regime. In short, they find that stellar feedback can strongly suppress MBH gas accretion, and that it is only in the presence of a nuclear star cluster (NSC) that more gas is funnelled towards the central few parsecs, boosting both the gas accretion onto the MBH and the amount of star formation in the NSC. Similar to Sivasankaran et al. (2022), Partmann et al. (2025) also find that MBH gas accretion (combined with nuclear star formation) is episodic over time, and that these episodes are strongly regulated by nearby supernova explosions. However, despite the inclusion of other stellar feedback processes in Partmann et al. (2025), their separate impact on MBH growth is not assessed. Also, the interaction of ionising radiation from young massive stars with the ISM is not explicitly simulated, but instead modelled in an approximate way following a Strömgren sphere approach (which can e.g. significantly reduce galactic outflows; see Emerick et al. 2018). Thus, the extent to which individual stellar feedback processes can regulate MBH gas accretion in the low-mass dwarf galaxy regime remains uncertain.
To assess the regulating power of stellar feedback on MBH growth, we conducted a suite of high-resolution radiation-hydrodynamic simulations called NOCTUA1, in which low-mass MBHs are allowed to accrete gas (without AGN feedback) in an isolated low-mass dwarf galaxy system, with and without different stellar feedback processes included. To achieve this, we introduced and applied the AREPONOCTUA numerical framework for BHs in galaxy simulations, whereby the chemical evolution of the gas is explicitly modelled using a time-dependent non-equilibrium chemical network. A novel physically motivated model for BH gas accretion was applied, avoiding the ambiguity of Bondi-Hoyle-Lyttleton accretion described above. For this study, two types of stellar feedback were considered: individually traced type II supernova (SNII) explosions, and radiatively transferred (on-the-fly) ionising stellar radiation (ISR) from OB stars. By carefully analysing how the multi-phase ISM of the low-mass dwarf galaxy gradually changed when incorporating the different stellar feedback processes to the numerical set-up, the individual and cumulative impact of stellar feedback on MBH gas accretion was assessed in great detail. In a subset of simulations, we studied how the gas accretion onto the MBH varies for different MBH initial masses, and whether or not an under- or overmassive BH is more or less favourable for sustained MBH growth (compared to our fiducial set-up). Lastly, we explored the effect of artificially induced gas inflows towards the galactic centre, mimicking strong gas inflows potentially happening in a cosmological setting and possibly at high redshift, and whether or not this can boost further gas accretion onto the MBH.
The paper is structured as follows. Section 2 describes the AREPONOCTUA numerical framework used to conduct the NOCTUA suite of simulations. The main results of our simulations are presented in Sect. 3, while the results from the simulations of artificially induced gas inflows are instead introduced and discussed in Sect. 4. How our numerical model and results compare to previous studies is also discussed in Sect. 4. Our main findings are summarised in Sect. 5.
2. Methodology
This section introduces the AREPONOCTUA numerical framework for BHs in galaxy simulations. The hydrodynamics and physical framework for gas chemistry, star formation, and stellar feedback are all described in Sects. 2.1–2.3. Our implementation of BH gas accretion is presented in Sect. 2.4, while the construction of initial conditions of our low-mass dwarf galaxy system is described in Sect. 2.5. The full suite of simulations making up NOCTUA is presented in Sect. 2.6.
2.1. Simulation code
The simulations were performed using the moving-mesh hydrodynamic code AREPO (Springel 2010), in which the conservation laws of hydrodynamics (assuming an ideal gas equation of state with an adiabatic index γ = 5/3) are solved on a time-dependent mesh defined by the Voronoi tessellation of a set of discrete points. By allowing the mesh-generating points to move with the velocity of the local flow, a quasi-Lagrangian formulation is obtained, and the mesh is automatically and continuously adjusted in spatial resolution depending on the local density (i.e. cells will aim to retain a constant mass). The code also allows for adaptive mesh refinement, where cells are (de-)refined based on a set of (de-)refinement criteria (see Sect. 2.4.2 for more details on the refinement strategy adopted in this work).
Dark matter (DM) and stars are treated as collisionless N-body particles, and thus only interact with the gas (and each other) via gravity. The code is coupled to a N-body solver in which the gravitational field is calculated on a tree-based approach, utilising an adapted and improved version of the technique developed for GADGET-2 (Springel 2005).
2.2. Chemical network
To model the chemistry and chemical evolution of the gas, the NL97 time-dependent non-equilibrium chemical network from Glover & Clark (2012) was adopted (originally implemented in AREPO by Smith et al. 2014). The network combines a treatment of hydrogen chemistry (including H2 formation and destruction) based on the work by Glover & Mac Low (2007a,b), with a simplified treatment of CO formation and destruction based on Nelson & Langer (1997). The network has been extensively applied to numerous previous studies in a wide range of physical set-ups, such as molecular clouds in a Galactic centre environment (Bertram et al. 2015), spiral arms of a Milky Way-like galaxy (Smith et al. 2014), giant star-forming molecular clouds in a M51-like galaxy (Tress et al. 2020), as well as the entire central molecular zone (Sormani et al. 2020; Tress et al. 2024). Hence, only a short summary of the chemical network is given below. For more details, we refer to the previous studies already mentioned, and to the detailed description of the network in Sect. 3.4 of Sormani et al. (2018).
Changes in the chemical composition are tightly coupled to the heating and cooling of the gas. To compute the reaction terms of chemical species and the radiative- and chemical heating and cooling terms, some key quantities for the gas are initially needed to be estimated. First, the dust grain number density was calculated assuming a constant dust-to-gas ratio of 10−3 (equivalent to 10% of solar metallicity gas; see e.g. Ferrière 2001). The dust grain temperature was determined via the same procedure as in Appendix A of Glover & Clark (2012). Second, the intensity of the interstellar radiation field was calculated by first allowing it to be spatially constant at 10% of the solar neighbourhood value (Draine 1978), and then attenuated via dust extinction and H2 and CO self-shielding (using the TREECOL algorithm developed by Clark et al. 2012). Last, the intensity of the cosmic-ray ionisation rate was determined by assuming it to be spatially constant (zero attenuation) at ζH = 3 × 10⁻¹⁸ s−1 (corresponding to 10% of the solar neighbourhood value inferred by Goldsmith & Langer 1978). On this basis, the H and CO chemistry of each gas cell was calculated in a time-dependent non-equilibrium way. The associated heating and cooling rates were simultaneously and self-consistently inferred for T < 104 K gas. For higher temperatures, the contribution of H excitation cooling (‘Lyman-α cooling’) was computed using the non-equilibrium HI abundance provided by the chemical network, whereas for the contributions made by the permitted lines of He and metals, we instead used tabulated cooling rates from Gnat & Ferland (2012), computed assuming collisional ionisation equilibrium. We note that in the current implementation of the chemical network, a temperature floor of 20 K was imposed. This was to avoid numerical instabilities occasionally arising when gas cells close to the resolution limit are undergoing strong adiabatic cooling. For the simulations of this study (with a target mass resolution of 20 M⊙ per gas cell), this is equivalent to a Jeans length (Jeans 1902) of ∼0.3 pc. Since this is comparable or below the maximum spatial resolution of the gas (see Fig. B.1), we do not expect this temperature floor to have any strong influence on the overall results of our simulations.
2.3. Star formation and stellar feedback
Star formation was modelled on a sub-grid level following the star particle approach by Göller et al. (2025). To determine whether an active gas cell is star-forming or not, the local Jeans mass, MJ, of the cell was calculated as follows:
 (1)
(1)
where ρ and ein are the mass density and specific internal energy, respectively, of the gas cell, and G is the gravitational constant. If the mass of the cell Mcell > MJ/N, where N = 8 (following the criterion by Truelove et al. 1997), the cell is flagged as ‘possibly star-forming’. The probability, p, of a possibly star-forming gas cell forming a star particle is given by the following expression:
 (2)
(2)
where Mcell is the mass of the cell, Δt is the current timestep of the simulation, and SFR is the local star formation rate (SFR) in the cell, defined as
 (3)
(3)
in which the local star formation efficiency per free-fall time is ϵff = 0.01. At star formation, star particles are populated by individual massive stars (8 < M★ < 120 M⊙) sampled from the high-mass end of the Kroupa initial mass function (IMF, Kroupa 2001), following the technique of Sormani et al. (2017). Consequently, star particles do not represent individual stars, but instead small stellar clusters (who on average fully sample the IMF) that evolve and interact with the ISM via stellar feedback. For this study, two types of stellar feedback are considered: SNII and ISR, each described separately below. Stellar mass loss and metal injection are not considered.
2.3.1. Type II supernova feedback
Whenever a sampled massive star (> 8 M⊙) reaches the end of its lifetime (inferred from Table 25.6 in Maeder 2009), a SNII explodes at the location of its host star particle, injecting energy into the surrounding medium following the prescription of Tress et al. (2020). In short, the injection region of a SNII is determined by the radius, Rinj, which is defined as the smallest possible radius of a sphere containing 40 gas cells around the host particle. Based on the mean density of gas cells within the injection region, the radius RST of a SN remnant at the end of its Sedov-Taylor phase is calculated (assuming a SN energy of 1051 erg). If the Sedov-Taylor phase of the SN remnant is resolved, i.e. if RST > Rinj, a thermal energy of 1051 erg is isotropically injected into the region (R < Rinj), and all gas is fully ionised. On the other hand, if the Sedov-Taylor phase is unresolved, i.e. if RST < Rinj, direct injection of thermal energy is unreliable due to numerical ‘overcooling’, making it impossible to generate a strong shock and deposit the correct amount of kinetic energy into the ISM. Instead, the SNII is modelled in a momentum conserving way, where the interior of the injection region is heated to 104 K and momentum is injected following the analytical solution of the so-called snow-plow phase (see e.g. Gatto et al. 2015; Martizzi et al. 2015). Due to the relatively small amount of stellar mass in our low-mass dwarf galaxy, and hence a low expected rate of type Ia supernovae (SNIa; see e.g. Maoz & Mannucci 2012), no SNIa feedback is included for this study.
2.3.2. Ionising stellar radiation feedback
Star particles hosting at least one sampled O/B star are treated as ionising sources. The radiated photons are advected through the simulation domain by solving the radiative transfer (RT) equation on the fly using the SWEEP code (Peter et al. 2023). The number of ionising photons injected per unit time into the domain by each star particle, is determined by the sum of ionising photon rates for every O and B star assigned to each particle. The rates of ionising photons for individually sampled OB stars are calculated assuming black body radiation, using the surface temperatures and stellar radii (at their main sequence phase) of Ekström et al. (2012). A single frequency bin is adopted for energies above 13.6 eV. The advected photons are passed as an input to the thermochemistry routine, in which they can ionise H and heat the gas. With the current implementation, no radiation pressure is considered.
To obtain more realistic gas temperatures in HII regions, we post-processed our simulation data, taking into account a smooth transition from nebular cooling at 2.0 × 10⁴ K to collisional ionisation equilibrium at 3.5 × 10⁴ K (instead of a sharp cut used on the fly) following Kim et al. (2023a). We also split our on-the-fly single ionising frequency bin into three separate bins: (13.6, 15.2) eV, (15.2, 24.6) eV, and (24.6, ∞) eV. While post-processing, only the radiation transport and thermochemistry of the gas was allowed to evolve2.
2.4. Black hole gas accretion
The central MBH was treated as a collisionless sink particle, i.e. beyond gravitationally interacting with the DM, stars, and gas, it was also allowed to skim mass from nearby gas cells. With the high gas resolution achievable in the simulations of this study (see Table 1), reaching sub-parsec maximum spatial resolution (enough to resolve the Bondi radius of cold and warm gas around a 104 M⊙ MBH; see Fig. B.1), the gas accretion onto the MBH was modelled in a physically motivated mass-flux approach, instead of the commonly adopted analytical solution of Bondi-Hoyle-Lyttleton accretion (which has several numerical uncertainties as described in Sect. 1).
In Fig. 1, we illustrate how the gas accretion onto the MBH is modelled on a grid- and sub-grid level (left and right side of the figure, respectively). For the MBH to skim mass on a grid level, individual gas cells are required to fulfil a set of accretion criteria:
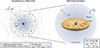 |
Fig. 1. Sketch of how the MBH gas accretion model described in Sect. 2.4 behaves on a (sub-)grid level (including some typical length scales adopted for this work). Left: On a grid level, gas cells inside the refinement radius, rref, and the accretion radius, racc, are geometrically refined to ensure that the accretion region, r < racc, of the MBH is always resolved by at least a few tens of gas cells (see Sect. 2.4.2 for more details). Whenever at least one active gas cell inside the accretion region fulfils the accretion criteria, the code first estimates the infalling gas accretion rate according to Eq. (4), and then skim mass of individual gas cells following Eq. (5). Right: If the infalling gas accretion rate Ṁin > 0.02 ṀEdd (or if ṀBH is already sufficiently high from the previous timestep), the skimmed gas is set to evolve on a sub-grid level. There, it is initially placed into a reservoir from which it is allowed to fall on a free-fall timescale down to the so-called circularisation radius, rcirc (the radius at which an accretion disc is expected to form). Finally, the gas is accreted onto the MBH on a viscous timescale (see Eq. 7), assuming a geometrically thin, optically thick accretion disc. When Ṁin < 0.02 ṀEdd, the accretion timescale is expected to be very short (compared to the viscous timescale); thus, no time-lag effects are considered. Instead, the skimmed gas is directly accreted onto the MBH (see Sect. 2.4.1 for more details). |
-
The position r of the gas cell is inside the accretion radius racc of the MBH.
-
The gas cell is gravitationally bound to the MBH, i.e. U > (Ek + Ein), where U = GMBHmcell/r is the cell’s gravitational binding energy to the MBH (for a gas cell of mcell in mass), Ek = mcellΔv2/2 is the kinetic energy associated with its motion (with respect to the MBH), and Ein = mcellein is its internal energy.
-
The flow of the gas represented by the cell is converging onto the MBH. This is achieved by ensuring that the divergence of the velocity and acceleration vector (with respect to the velocity and acceleration of the MBH) is negative (i.e. ∇ ⋅ v < 0 and ∇ ⋅ a < 0, respectively).
In the event of one or more gas cells fulfilling the accretion criteria (marked by green dots in Fig. 1), the infalling gas accretion rate onto the MBH is estimated as
 (4)
(4)
where ⟨ρ⟩ and ⟨vr⟩ is the non-weighted mean density and mass-weighted mean radial velocity, respectively, of only the gas cells fulfilling the accretion criteria. For the same set of gas cells, mass is then skimmed on a cell-by-cell basis (indicated by green arrows in Fig. 1) as follows:
 (5)
(5)
where N is the total number of gas cells fulfilling the accretion criteria. The amount of mass skimmed from a gas cell is therefore proportional (but capped at 90%) to the cell’s total initial mass. To ensure that the momentum of the system is conserved over time, skimmed gas cells are required to transfer an equivalent amount of momentum (with respect to the amount of mass skimmed) to the MBH. We note that when skimming mass of individual gas cells, strong variations in the gas density inside racc can occasionally arise and cause unwanted effects (e.g. unphysical ejections of gas from the accretion region). To avoid numerical artifacts of this kind, we manually ‘smooth’ the density of skimmed gas cells to their (non-weighted) average value after every accretion event.
2.4.1. Sub-grid gas accretion model
Below the resolution limit, a sub-grid treatment for the gas accretion onto the MBH similar to Yuan et al. (2018) was adopted. For the radiatively efficient regime, i.e. when ṀBH > 0.02 ṀEdd3, a geometrically thin, optically thick accretion disc is expected to arise at the so-called circularisation radius rcirc of the infalling gas, and fuel the MBH via the loss of angular momentum in the gas due to viscous forces in the disc. To model the evolution of this, time-lag effects are introduced to delay the gas accretion from newly skimmed gas onto the MBH (an approach previously adopted in numerous one- and two-dimensional simulations performed by e.g. Ciotti & Ostriker 2007; Ciotti et al. 2009, 2017; Novak et al. 2011; Gan et al. 2014).
Based on the infalling gas accretion rate at racc according to Eq. (4), the time evolution of the effective gas accretion rate onto the accretion disc can be written as
 (6)
(6)
assuming a free-fall timescale4 for the gas transport from racc down to rcirc (each extent indicated by a dashed black line in the right-hand sketch of Fig. 1). Gas that is not directly fuelled onto the accretion disc in a given timestep is placed into a ‘reservoir’ (Mreserv in Fig. 1), from which the gas is allowed to continue to fuel the accretion disc on a free-fall timescale, but at later times as the simulation progresses. If the supply of infalling gas suddenly ends (temporarily or for a longer period of time) – that is, when Ṁin(racc) = 0 – Eq. (6) implies that the rate of which gas will continue to fuel the accretion disc (assuming there is already an existing reservoir of gas), will exponentially decrease over time, until the reservoir is depleted.
The accretion disc (Mdisc in Fig. 1) fuels the MBH on the instantaneous viscous timescale (Kato et al. 2008):
 (7)
(7)
assuming a geometrically thin, optically thick accretion disc, where α is the viscosity parameter (Shakura & Sunyaev 1973) and rs is the Schwarzschild radius (rs ≡ 2GMBH/c2). The circularisation radius rcirc is essentially a free parameter which can be scaled for instance with the Schwarzschild radius of the MBH (Yuan et al. 2018). However, in this work we adopt a different approach, by estimating rcirc based on the angular momentum of the infalling gas (but without tracking the individual spin evolution of the MBH). For more details regarding this, see Appendix A. The inflowing gas accretion rate onto the MBH from the accretion disc is estimated as
 (8)
(8)
where Mdisc is the total mass of the accretion disc (r < rcirc in Fig. 1). The final MBH gas accretion rate follows as
 (9)
(9)
where Ṁw is the mass flux of winds expected to arise as the gas spirals inwards towards the MBH. However, since feedback from the MBH is neglected in this study5, Ṁw is set to zero, meaning that ṀBH = Ṁdisc,inflow.
For the radiatively inefficient regime – that is, when ṀBH < 0.02 ṀEdd – there is no well-defined circularisation radius (Bu & Yuan 2014) for the infalling gas, and the geometrically thin disc approximation mentioned above is therefore no longer valid. Instead, the gas accretion flow is expected to be geometrically thick, optically thin, and advection-dominated. Additionally, the accretion timescale is expected to be very short compared to the viscous timescale in the radiatively efficient regime (Narayan & Yi 1995). Time-lag effects are therefore neglected, and the newly skimmed gas is instead directly accreted onto the MBH. We note that it is both the infalling gas accretion rate Ṁin(racc) and the instantaneous ṀBH from the previous timestep that determines which regime the gas accretion onto the MBH should be modelled according to, in other words, if  , newly skimmed gas is set to follow the radiately efficient regime’s sub-grid model (described above), otherwise, it follows the radiately inefficient regime’s direct accretion approach. This ensures that the gas accretion from an already massive accretion disc can keep the MBH in the radiatively efficient regime (regardless of Ṁin).
2.4.2. Refinement strategy
Based on the standard (de-)refinement criteria in AREPO, the code will at any given time try to keep the mass of all individual gas cells as close as possible (within a factor two) to the designated target mass resolution (20 M⊙ in our case) of the simulation. On top of this, we employ two additional geometrical refinement criteria around the central MBH. By applying a first layer of maximum volume limit on the gas cells inside the refinement radius rref = 10 pc (see left side of Fig. 1), we ensure that gas cells close to the MBH are comparable in size (or smaller) to the size of the accretion region (racc = 1 pc). We then apply a second layer of maximum volume limit on the gas cells inside racc, to ensure that the accretion region (r < racc) is always resolved by at least a few tens of gas cells. By gradually refining the gas cells as they get close to the MBH via these two layers of geometrical refinement, we make sure that gas cells will continue to enter the accretion region as the simulation progresses. Additionally, the code will at any given time try to avoid having neighbouring gas cells of too large volume difference (to ensure numerical stability); thus, in the situation of two neighbouring gas cells having a volume ratio greater than eight, the larger gas cell will be refined.
2.5. Initial conditions
The low-mass dwarf galaxy system used to conduct the simulations of this study was generated in isolation using the code and method developed by Springel et al. (2005). Two components initially make up the system: a DM halo (2 × 10¹⁰ M⊙) and a gaseous disc (5.3 × 10⁷ M⊙). The mass distribution of the DM halo follows a Hernquist (1990) profile with an enforced NFW-equivalent (Navarro et al. 1996) density profile at the centre, whereas the gaseous disc is modelled according to an exponential surface density profile. To minimise the effect of numerical dynamical heating on the MBH due to the limited mass resolution of DM particles (Hernquist & Barnes 1990), while trying to keep the additional computational cost minimal, the DM mass resolution is set to 500 M⊙ per particle. When generating the initial conditions (IC), parameter values are chosen in such a way that the resulting physical properties of the system broadly agree with previous studies of simulated dwarf galaxies (Hu et al. 2016; Whitworth et al. 2022). The obtained physical properties, together with the mass resolution and gravitational softening length of each component, are summarised in Table 1 (the small baryonic mass fraction is in agreement with the abundance matching results of Moster et al. 2010, 2013). After generating the ICs, an MBH (in the mass range of 103−6 M⊙) is manually added to the galactic centre. The initial metallicity of the gas is set to 0.1 Z⊙ (assuming the same relative abundance pattern as inferred for the Sun; see Asplund et al. 2009) uniformly across the gaseous disc. Prior to any analysis, the system is initially simulated for ∼800 Myr at a coarse target mass resolution (500 M⊙ per gas cell), enough to experience an initial burst of star formation and reach a steady-state. This is enabled by reducing the stellar lifetimes of massive stars by a factor of 10, speeding up the injection of energy into the ISM from SNII (ISR is not yet included). As a final preparation, the system is run for an additional ∼200 Myr without the reduction of stellar lifetimes (but with no risk of running out of gas since the total gas depletion time of the system is > 10 Gyr), during which the target mass resolution is gradually improved to the desired value of the analysis (20 M⊙ per gas cell). This is to ensure that smaller-scale structures, typically arising at higher resolution, are already formed and well relaxed at the start of the analysis. During this first gigayear, the MBH is not allowed to skim mass, but can dynamically evolve (e.g. with nearby star particles).
2.6. Suite of simulations
Using the numerical and physical set-up described above, a suite of high-resolution radiation-hydrodynamic simulations called NOCTUA were performed. Throughout the full suite, the target mass resolution and the MBH accretion radius were set to 20 M⊙ per gas cell and 1 pc, respectively (motivated by the resolution study presented in Appendix B). The simulations were divided into three subsets depending on the scientific question they aim to address. For the first subset of simulations, stellar feedback processes were gradually added to the numerical set-up in order for us to examine their individual and cumulative impact on MBH gas accretion. Within this subset, the initial mass of the MBH was set to 104 M⊙, in agreement with recent detections of MBH candidates in dwarf galaxies (e.g. Sacchi et al. 2024), and in broad alignment with what is expected from local scaling relations (see e.g. Reines & Volonteri 2015). For the second subset of simulations, the influence of the MBH initial mass on the gas accretion was investigated, by varying the initial mass between MBH = 103−6 M⊙. In the last subset of simulations, we explored whether or not it is possible to boost the gas accretion onto the MBH via induced gas inflows towards the galactic centre, by artificially reducing the angular momentum of the gas in the galaxy (mimicking the effect of strong gas inflows potentially happening in a cosmological setting). The full list of subsets and their respective simulations, which together make up the NOCTUA suite of simulations, is summarised in Table 2.
NOCTUA suite of simulations.
To demonstrate the physical framework used to conduct the NOCTUA suite of simulations, Fig. 2 shows an example simulation (MBH4_full in Table 2) in which all of the above mentioned stellar feedback processes are included. In panel a, we show the face-on projected column density map of the HI surface density in our low-mass dwarf galaxy at t ∼ 500 Myr. By zooming in on one of the many ISM ‘bubbles’ recently created by SNII explosions (panel b), and further zooming in on one of the groups of recently formed star particles (panel c), we can see the effect of ionising radiation produced by newly formed O and B stars. We can also distinguish the molecular cloud from which the newly formed star particles were born (panel d). Lastly, panel e shows a zoom-in on the region close to the MBH, with a further zoom-in on the MBH accretion region (r < racc) in panel f. As intended by the refinement strategy outlined in Sect. 2.4.2, the region inside the accretion radius racc is resolved by at least a few tens of gas cells. Without this refinement, there is no guarantee that the MBH will always have gas cells to skim mass from, in other words, there is a risk that the code might miss skimming mass from potential gas cells.
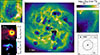 |
Fig. 2. Visual demonstration of the complete physical framework described in Sect. 2. Panel (a): Face-on projected column density map of the HI surface density in the low-mass dwarf galaxy at t ∼ 500 Myr in the MBH4_full simulation (see Table 2). Panel (b): Zoom-in on a recently active star-forming region where SNII explosions have injected energy into the surrounding gas, pushing it in all directions shaping a ‘bubble’ in the ISM. Star particles formed during the simulation are indicated and colour-coded according to their stellar age (normalised between 0 and 100 Myr, where blue represents the youngest and red the oldest stellar populations, respectively). Panels (c)–(d): Further zoom-in on a group of young star particles from panel b. By displaying face-on projected column density maps of the HII and H2 surface densities, side-by-side, we can distinguish the molecular cloud from which the star particles were born from (panel d), and how the ISR (modelled using radiative transfer on the fly) from individually sampled O and B stars propagates and ionises the surrounding gas (panel c). Panel (e): Zoom-in on the region close to the central MBH. Panel (f): Further zoom-in on the MBH and its accretion radius racc (dashed black circle), with a slice (aligned in the z direction with the MBH) through the gas displaying its Voronoi structure. At this scale, individual gas cells can be seen inside the accretion region (r < racc), highlighting the refinement strategy outlined in Sect. 2.4.2. |
3. Results
We proceed by showing the main results from the NOCTUA suite of simulations in the following way. Section 3.1 presents the impact of stellar feedback on MBH growth from the ‘Stellar Feedback’ simulations (see Table 2). This is followed by a detailed analysis of the ISM in Sect. 3.2, which is further extended in Sect. 3.3, by exploring the properties of inflowing and outflowing gas close to the MBH. Lastly, in Sect. 3.4, we address to what extent the MBH initial mass influences the gas accretion (the ‘Black Hole Mass’ simulations in Table 2).
3.1. Stellar feedback regulated massive black hole growth
In the top panel of Fig. 3 we show the amount of mass accreted over time by an initial 104 M⊙ MBH in the Stellar Feedback simulations. Without any stellar feedback included (blue line), the MBH grows steadily over time, increasing its mass by ∼100% of its initial mass after 800 Myr. With the addition of type II supernova feedback (SNII, orange line), the growth of the MBH is suppressed by more than an order of magnitude (already during the first 150 Myr). However, when only considering ISR feedback (purple line), the opposite effect can be seen, where the growth of the MBH is instead enhanced at all times compared to the no stellar feedback run. Yet, when SNII is combined with ISR (SNII+ISR, red line), the growth of the MBH remains significantly suppressed, but with an overall slightly higher MBH growth throughout the full simulation compared to the SNII-only feedback run. The bottom panel of Fig. 3 shows the corresponding time evolution of the MBH Eddington ratio (fEdd = ṀBH/ṀEdd) in each of our simulations, illustrating that SNII feedback not only reduces fEdd (i.e. the rate at which gas accretes onto the MBH), compared to the no stellar feedback run, but also makes it more episodic over time with occasional time periods of no gas accretion at all. The addition of SNII feedback moves the MBH from having a continuous steady gas accretion rate at fEdd ≳ 0.02 in the radiatively efficient regime, to instead more consistently accrete at fEdd < 0.02 in the radiately inefficient regime. The effect of ISR feedback on fEdd is less striking than when SNII feedback is included, but is still apparent, as it slightly increases fEdd at close to all times, regardless of whether SNII feedback is already included or not.
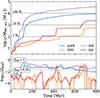 |
Fig. 3. Top: Amount of mass accreted over time by the MBH in our Stellar Feedback simulations (see Table 2). Dashed lines indicate the percentage growth of an initial 104 M⊙ MBH. Bottom: Corresponding time evolution of the MBH gas accretion rate (in terms of the Eddington fraction fEdd = ṀBH/ṀEdd). Transparent background lines correspond to the obtained gas accretion rate of individual snapshots, while opaque lines mark the running mean value over 20 Myr. |
With the gas being the only source of mass for the MBH to accrete from (at least in this study), a detailed view of the ISM in the low-mass dwarf galaxy is needed to robustly understand the regulating power of stellar feedback on MBH growth. In Fig. 4, we therefore present a series of face-on and edge-on projected column density maps displaying the total gas, HI, H2, and HII surface densities, as well as the gas temperature (columns left to right), in each of the Stellar Feedback simulations (top row: MBH4_noFB, second row: MBH4_SNII, third row: MBH4_ISR, bottom row: MBH4_full) at t ∼ 380 Myr. From visual inspection, it is evident that SNII feedback strongly disrupts the collapse of cold dense gas, hindering the formation of H2 by heating and partially ionising the gas. However, it is only with ISR feedback that prominent and well-confined HII regions start to appear throughout the galaxy. When only ISR feedback is included (i.e. no SNII feedback), the ISM is visually less clumpy compared to the no stellar feedback run, but not as diffuse and hot as when SNII feedback is present. In fact, by estimating the fraction of mass enclosed in the least volume-filling gas (at t ∼ 380 Myr), taking into account the total gas mass and volume of the low-mass dwarf galaxy (confined to R < 2.5 kpc and |z|< 100 pc, centred around the mid-plane of the galaxy), indeed the ISM is most ‘clumpy’ when no stellar feedback is considered. For the no stellar feedback run, ∼70% of the total gas mass is concentrated to the 10% least volume-filling gas. This is followed by the ISR-only feedback run, where ∼40% of the mass is concentrated to the same volume fraction, and least so in the simulations of SNII feedback, where the mass fraction in both simulations are ∼20%. With a less clumpy ISM, a higher fraction of the total gas mass is expected to reside in the ambient (more diffuse) medium, enabling more gas to be accreted onto the MBH. This partly explains why the MBH grows the most when only ISR feedback is included (see Fig. 3), despite the visually larger amount of H2 (expected to be a main fuel source for the MBH) seen in the no stellar feedback run. Nevertheless, this is not sufficient to explain the suppression of MBH growth seen when SNII feedback is present, meaning that other mechanisms are also likely to take part in regulating MBH gas accretion.
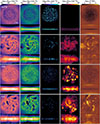 |
Fig. 4. Collection of projected column density maps for the total gas (first column), HI (second column), H2 (third column), and HII (fourth column) surface densities, as well as density-weighted gas temperature maps (fifth column), of the low-mass dwarf galaxy at t ∼ 380 Myr in our Stellar Feedback simulations (see Table 2). For every map, both the face-on (top) and edge-on (bottom) projected view of the galaxy are included. |
3.2. A multi-phase interstellar medium
We extend our analysis from Sect. 3.1 in trying to link the discrepancy in MBH growth (due to which stellar feedback processes are included or not) with the ISM composition (and distribution) of our low-mass dwarf galaxy, by categorising individual gas cells according to their ISM phase. As has already been demonstrated in Fig. 4, the projected hydrogen column densities (second to fourth column) are distinctly different depending on the stellar feedback process(es) included. By classifying individual gas cells according to both their temperature and hydrogen abundances, following the ISM phase definitions of Kim et al. (2023b), we can more thoroughly disentangle the individual and cumulative impact of SNII and ISR feedback on the ISM composition (and distribution) of our low-mass dwarf galaxy in the Stellar Feedback simulations. The adopted ISM phases of Kim et al. (2023b) and their respective definitions, are summarised in Table 3 (with the difference that we use the term ‘warm ionised medium’ for what they call ‘unstable ionised medium’). We illustrate how the gas is split into different phases in Fig. 5 (using the definitions in Table 3), by showing the HI abundance as a function of gas temperature for the ISM (at t ∼ 380 Myr) in the MBH4_full simulation, mass-weighted by the total amount of H per bin, and indicate different regions according to their ISM phase (using the abbreviations in Table 3). A substantial amount of H can be located in the unstable neutral medium phase (UNM), as well as the warm neutral, ionised, and photoionised medium phases (WNM, WIM and WPIM, respectively). This agrees well with Hu et al. (2016), who find that the ISM in a similar dwarf galaxy set-up is dominated by 100 K ≤ T ≤ 3 × 10⁴ K gas. In Fig. 6, we show the corresponding phase diagram (gas temperature as a function of H number density) for the same snapshot of the ISM in the MBH4_full simulation as in Fig. 5, mass-weighted by the total amount of H per bin, and colour-coded according to the ISM phase definitions in Table 3. Compared to Fig. 5, where the most visually populated ISM phases are clearly disentangled from one another, Fig. 6 shows instead a significant overlap for the UNM, WNM, WIM, and WPIM phases. Thus, by only applying temperature ranges to define ISM phases (which is traditionally done), chemically different ISM phases are at risk of being treated the same, despite being associated with vastly different physical processes (as discussed below).
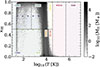 |
Fig. 5. Abundance of HI as a function of gas temperature in the ISM of our MBH4_full simulation (at t ∼ 380 Myr), mass-weighted by the total amount of H per bin. The ISM is split into different phases based on its HI, HII or H2 abundance, and gas temperature, following the definitions of Kim et al. (2023b) (summarised in Table 3). The CMM and WIM are categorised by their H2 and HII abundance, respectively. For the CMM, χH2 > 0.25, meaning that χHI < 0.75, while for the WIM, χHII > 0.5, implying that χHI < 0.5. These upper limits are indicated by blue and green upside-down triangles for the CMM and WIM, respectively. |
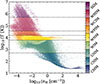 |
Fig. 6. Gas temperature as a function of H number density in the ISM of our MBH4_full simulation (at t ∼ 380 Myr), mass-weighted by the total amount of H per bin, and colour-coded according to the ISM phase definitions of Table 3 (temperature ranges are indicated by dashed lines). |
Using the ISM phase definitions in Table 3, Fig. 7 shows colour-coded face-on (top row) and edge-on (bottom row) slices (at z = 0 and y = 0, respectively) through the ISM in each of our Stellar Feedback runs (different columns as indicated). The UNM is the visually most dominating phase of the ISM in all of the physical set-ups. Extended regions of the cold neutral medium phase (CNM) with patches of the cold molecular medium phase (CMM) can primarily be seen in the no feedback run. However, extended regions of the CNM phase can also be distinguished in the ISR-only feedback run (but to a lesser extent compared to the no feedback run). It is only when SNII feedback is included that the CNM phase is strongly suppressed, together with the emergence of prominent regions of the hot and warm-hot ionised medium phases (HIM and WHIM, respectively). Similarly, the WIM phase is only prominent when ISR feedback is included.
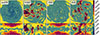 |
Fig. 7. Slices through the ISM in our Stellar Feedback simulations (see Table 2), with a face-on (top) and edge-on (bottom) view (at z = 0 and y = 0, respectively) of the low-mass dwarf galaxy at t ∼ 380 Myr, colour-coded according to the ISM phase definitions in Table 3. |
To further quantify the effect of SNII and ISR feedback on the ISM composition of our low-mass dwarf galaxy, in Fig. 8, we show mass-weighted probability density functions (integrated and averaged over 800 Myr) of the gas density (top row) and temperature (bottom), for different ISM phases (different columns as indicated) in each of our Stellar Feedback runs (different coloured lines). Tracking all of the above mentioned ISM phases (see Table 3) individually, and their respective relation (or not) to MBH growth, is very demanding and time-consuming. Hence, to reduce the complexity for the remaining part of the analysis, some of the hottest and coldest phases of the ISM are paired together into single phases in Fig. 8 (without causing any relevant loss of information). Since the CNM and CMM phases are both expected to be associated with star formation, and seemingly closely coupled to each other (see Fig. 7), we combine these two phases into one: CNM+CMM. Similarly, the HIM and WHIM phases seem to both be strongly correlated to SNII explosions; thus, they are combined into a single phase, HIM+WHIM. Lastly, since both the warm collisionally ionised medium (WCIM) and WPIM phases tend to appear in the outskirts of the HIM+WHIM phase (see Fig. 7), we also combine these two phases into one: WCIM+WPIM.
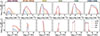 |
Fig. 8. Mass-weighted probability density functions (integrated and averaged over 800 Myr) of the gas density (top row) and gas temperature (bottom row) for different phases of the ISM (limited to gas inside R < 2.5 kpc and |z|< 300 pc of the low-mass dwarf galaxy mid-plane) in our Stellar Feedback simulations (see Table 2). To reduce the complexity of tracking each individual ISM phase of Table 3, some of the most hot and cold phases are paired together into single phases (see Sect. 3.2 for more details). Shaded areas correspond to one standard deviation (±σ). The sharp cuts in the gas temperature distribution functions are linked to how the different ISM phases are defined (see Table 3). |
As was expected, Fig. 8 shows that SNII feedback indeed is the main contributor to generating the HIM+WHIM phase (orange and red lines, in agreement with Hu et al. 2017). For building the WCIM+WPIM phase, both SNII and ISR feedback are seemingly strong contributors (but especially ISR feedback at high number densities), while for the WIM phase, only ISR feedback is able to significantly generate a substantial amount of gas in this phase (purple and red lines). A similar trend can be seen for the WNM and UNM phases, where both SNII and ISR are contributing to generating gas in these ISM phases (at high number densities). Unsurprisingly, the largest amount of CNM+CMM phases can found in the no stellar feedback run (blue line), followed by the ISR-only feedback run (purple line), and lastly the simulations where SNII feedback is included.
To make a fair comparison of how the different ISM phases in Fig. 8 relate to one another (irrespective of the amount of gas residing in the galaxy, which may vary due to differences in the SFR), Fig. 9 shows the time-integrated (over 800 Myr) average mass- and volume fraction (left and right column, respectively) of each ISM phase, both globally (R < 2.5 kpc and |z|< 300 pc, top panels) and locally at the vicinity of the MBH (R < 10 pc, bottom panels), in our Stellar Feedback runs. The hot- and warm ionised medium phases (WIM, WCIPM+WPIM, and HIM+WHIM) only marginally contribute to the total amount of mass in the ISM on a global scale across all runs (top left panel), but display significantly higher mass fractions close to the MBH when SNII feedback is included (bottom left panel). That said, these phases contribute more to the ISM in terms of volume (right column), but are still minor compared to the strong volume-filling of the WNM (especially on a global scale, top right panel). However, the UNM phase is overall the most mass- and volume-dominating phase of the ISM in our low-mass dwarf galaxy, both globally and close to the MBH, regardless of the stellar feedback process(es) included. This is true except for the mass fractions close to the MBH in the runs without SNII feedback included (bottom left panel), where the CNM+CMM phase is completely dominating the mass contribution to the ISM. We also note that the WNM is the most volume-filling phase of the ISM on a global scale in the no stellar feedback run (top right panel). This is because of the strong collapse of the gaseous disc along the z axis (see e.g. the edge-on slice of the ISM in Fig. 7 for the no stellar feedback run), enabling more of the surrounding WNM phase to be taken into account when calculating the volume fractions (since we consider all gas within |z|< 300 pc).
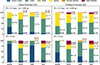 |
Fig. 9. Time-integrated (over 800 Myr) average mass- and volume fractions (left and right column, respectively) for different ISM phases in our Stellar Feedback simulations, both on a global scale (R < 2.5 kpc and |z|< 300 pc around the mid-plane of the low-mass dwarf galaxy, top panels) and on a local scale close to the MBH (R < 10 pc, bottom panels). Fractions < 0.1% are not displayed. |
The discrepancy in mass fractions on a global scale versus close to the MBH in Fig. 9 (e.g. in the CNM+CMM phase) suggests that the ISM composition of our low-mass dwarf galaxy is radially dependent as we approach the central MBH, and that it may vary depending on the stellar feedback process(es) included. To explore this further, Fig. 10 shows radial surface density profiles (integrated and averaged over 800 Myr, top row) and associated mass fraction profiles (bottom row), for different ISM phases (different columns as indicated), in each of our Stellar Feedback runs (different coloured lines). The estimated uncertainty of both profiles for each ISM phase is indicated by colour- (according to the simulation) shaded areas (corresponding to one standard deviation). No strong radial dependence for the surface densities can be distinguished among the different ISM phases, except for the WNM and CNM+CMM phases. The surface density of the CNM+CMM phase increases as we get close to the MBH, mostly in the runs without SNII feedback included (blue and purple lines), but also slightly when SNII feedback is considered (orange and red lines). With the surface density of the UNM phase seemingly being constant at all radii (for all the runs and with only small variations between them), this explains why the mass fractions of the CNM+CMM phase is the highest on a local scale close to the MBH, compared to on a global scale in Fig. 9 (especially for the runs without SNII feedback included). For the WNM phase, the surface density initially increases and decreases at large radii (∼1 kpc) for the runs with and without SNII feedback included, respectively, but then remains relatively stable as we approach the MBH. The mass fraction of the WNM phase is consistently higher at all radii in the runs with SNII included than in the runs without (bottom panel in the WNM column). Since the opposite effect can be seen for the CNM+CMM phase, where the mass fraction of the CNM+CMM phase is consistently higher at all radii in the runs without SNII included than with (bottom panel in the CNM+CMM column), we conclude that SNII feedback sustains a higher mass fraction of the ISM in the WNM phase, at the expense of mainly the CNM+CMM phase6. Lastly, we note that mass fractions for the HIM+WHIM and WCIM+WPIM phases increase as we get close to the MBH, possibly due to a higher SFR (as a consequence of the higher surface density of the CNM+CMM phase). However, we also note that the majority of ISM phases in Fig. 10 exhibit a large scatter (colour-shaded areas) in their respective surface density and mass fraction profiles at small radii, including the HIM+WHIM and WCIM+WPIM phases. This is likely due to the stochastic nature of star formation and stellar feedback. At large radii, the volume within which these processes act is substantially larger than at small radii, and is thus less affected by the stochasticity. At small radii however, a few stochastic events can significantly alter the ISM phase composition, explaining for example the slight increase in mass fractions in the HIM+WHIM and WCIM+WPIM phases seen in Fig. 9 (when SNII feedback is included), which is possibly due to a few SNII events occurring very close to the MBH.
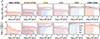 |
Fig. 10. Top row: Radial surface density profiles (integrated and averaged over 800 Myr) for different ISM phases in our Stellar Feedback simulations (see Table 2). The radius R is with respect to the position of the MBH, and the calculation of surface densities are limited to gas inside |z|< 300 pc of the MBH. Bottom row: Corresponding mass fraction as a function of radius for each ISM phase in the top row. Shaded areas correspond to one standard deviation (±σ). |
3.3. Properties of inflowing and outflowing gas
As was stated in Sect. 3.2, the composition of the ISM does not only distinctly differ between our Stellar Feedback simulations, but can also spatially vary within the low-mass dwarf galaxy. How this relates to the growth of the MBH is however not trivial. To address this, Fig. 11 shows the average gas inflow (top row) and outflow (bottom row) rate as a function of radius (with respect to the position of the MBH) for different ISM phases (different columns as indicated) in our Stellar Feedback simulations (different coloured lines). For each ISM phase, the gas inflow and outflow rate is estimated as: Ṁ = 4 π r2 ⟨|vr|⟩ ⟨ρ⟩, where ⟨|vr|⟩ and ⟨ρ⟩ are the mean absolute radial velocity (with respect to the MBH) and mean density, respectively, of inflowing (vr < 0) and outflowing (vr > 0) gas through a spherical shell of radius r and thickness dr. The estimated uncertainty of gas inflow and outflow rates for each ISM phase is indicated by colour- (according to the simulation) shaded areas (corresponding to one standard deviation). As expected, whenever SNII feedback is included, a greater exchange of inflowing and outflowing gas in the hot and warm phases (HIM+WHIM, WCIM+WPIM, and WNM) can be distinguished at all radii, compared to the runs without SNII feedback included. The same is true for the WIM phase when ISR feedback is included. For the UNM and CNM+CMM phases, the average inflow and outflow rates are close to identical between the different runs, except close to the MBH. At this scale, the average inflow and outflow rates of the UNM and CNM+CMM phases tend to be slightly higher when no SNII feedback is considered (blue and purple curves), compared to the SNII feedback runs (orange and red curves). This suggests that the UNM and CNM+CMM phases are mainly responsible for the enhanced MBH growth seen in Fig. 3, when no SNII feedback is included. However, the estimated uncertainty of the gas inflow outflow rates in Fig. 11 is substantial, especially at small radii close to the MBH. In addition to that, the gas inflow rate at a certain radius is typically matched by a roughly equal amount of gas outflow, meaning that it is difficult to identify any significant net-inflows towards the MBH.
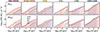 |
Fig. 11. Time-integrated (over 800 Myr) average radial profiles of the gas inflow (top row) and outflow (bottom row) rate for different ISM phases in our Stellar Feedback simulations (see Table 2). The radius R is with respect to the position of the MBH, and the average gas inflow and outflow rate in each radial bin is calculated for a spherical shell around the MBH (see Sect. 3.3 for more details). Shaded areas correspond to one standard deviation (±σ). |
To more precisely study how the inflowing and outflowing gas of various ISM phases correlate with the gas accretion onto the MBH, Fig. 12 shows a cut-out of the time evolution (between 100 and 400 Myr) of the gas inflow (panel a) and outflow (panel b) rate at the vicinity of the MBH (through a sphere with an inner and outer boundary of R = [1, 3] pc around the MBH) for different ISM phases (different coloured lines), in our Stellar Feedback runs. Figure 12 also shows the corresponding time evolution of the MBH gas accretion rate ṀBH and its Eddington accretion limit ṀEdd (panel c), the time evolution of the total gravitational binding- (solid blue line), thermal- (dashed orange line), and kinetic energy (dotted green line) of all the inflowing and outflowing gas (between R = [1, 3] pc, panel d), as well as the radial distance (with respect to the position of the MBH) to nearby SNII explosions as a function of time (for the runs with SNII feedback included, panel e).
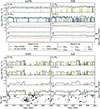 |
Fig. 12. Panels (a)–(b): Cut-out of the time evolution (between 100 and 400 Myr) for the gas inflow (panel a) and outflow (panel b) rate at the vicinity of the MBH (through a spherical shell at R = [1, 3] pc) for different ISM phases (coloured lines), in our Stellar Feedback simulations (see Table 2). Panel (c): Corresponding time evolution of the MBH gas accretion rate and its Eddington accretion limit (solid and dash-dotted black line, respectively). Panel (d): As a function of time, the total gravitational binding- (solid blue line), thermal- (dashed orange line), and kinetic energy (dotted green line) of all the inflowing and outflowing gas between R = [1, 3] pc. Panel (e): Radial distances (with respect to the position of the MBH) to nearby SNII explosions as a function of time. |
By comparing the gas inflow and outflow rates of each ISM phase (Fig. 12, panel a and b) with the time evolution of the MBH gas accretion rate (panel c), we can see that when no stellar feedback is considered (top left panels), a continuous net gas inflow of the CNM+CMM phase is the main contributor to the gas accretion onto the MBH. The same is true for the ISR-only feedback run (top right panels). However, compared to the no stellar feedback run, this scenario seems to enable a more significant net gas inflow of the UNM phase as well. With SNII feedback included (bottom row of panels), the continuous net gas inflow of the CNM+CMM phase is completely suppressed (with only occasional inflows and outflows over time), leaving the UNM phase (which is far more episodic over time compared to the no SNII feedback runs) and the WNM phase as the main sources for the MBH to skim mass from.
For the gravitational binding energy of all the inflowing and outflowing gas (Fig. 12, panel d), it is consistently higher than both the thermal and kinetic energy over time in the runs without SNII feedback included (top row panels), suggesting that a high fraction of the net-inflowing CNM+CMM phase fulfils the accretion criteria (defined in Sect. 2.4). With the inclusion of SNII feedback however (bottom row panels), the gravitational binding energy is instead comparable or below that of the thermal and kinetic energy, meaning that the likelihood for the net-inflowing UNM and WNM phases to fulfil the accretion criteria (gravitationally bound to- and a converging flow onto the MBH) is substantially lower. Consequently, the fraction of gas cells from which the MBH can skim mass also gets reduced.
Since the energy injection of a SNII explosion (1051 erg) is much higher than the typical gravitational binding energy of the inflowing and outflowing gas close to the MBH (∼1045 erg according to Fig. 11, panel d), SNII do not necessary have to explode in the direct vicinity of the MBH to regulate the gas accretion, but can also occur at larger distances and still indirectly influence the gas inflow towards the MBH. For the runs with SNII feedback included, we can see in panel e that whenever there is high number of relatively nearby (∼100 − 200 pc) SNII explosions, or only a few very nearby (10 s of pc) ones, the gas inflow drops (panel a), and the MBH gas accretion rate decreases (panel c). This also explains why the gas inflow (and thus the MBH gas accretion rate) is more episodic over time, than in the runs without SNII included.
Despite Fig. 12 showing strong gas inflows (e.g. in the runs without SNII feedback included, panel a), the majority of inflows are typically followed by outflows of similar strength (panel b), suggesting that the MBH only skims mass from a minor fraction of the total inflowing gas. To quantify this, Fig. 13 shows the cumulative net gas inflow (disregarding any net outflows) over time at the vicinity of the MBH (through a spherical shell at R = [1, 3] pc around the MBH) for different ISM phases (different coloured lines) in our Stellar Feedback runs (different panels as indicated). By comparing the total cumulative net gas inflow of all the different ISM phases (dashed black line), with the total amount of mass accreted by the MBH (solid black line), a conversion factor for how much of the total cumulative net gas inflow is contributed to the growth of the MBH is estimated (dash-dotted black line), for each run. Based on this, the conversion factor is the highest in the ISR-only feedback run (∼50%), followed by the no stellar feedback run (∼40%) and the SNII+ISR feedback run (∼20%), and the least in the SNII-only feedback run (∼10%). This agrees well with the gravitational binding energy being more comparable to the thermal and kinetic energy of the inflowing and outflowing gas close to the MBH when SNII feedback is included, compared to when no SNII feedback is considered (Fig. 11, panel e), making it more difficult for the inflowing gas to fulfil the accretion criteria.
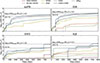 |
Fig. 13. Cumulative net gas inflow (disregarding any net outflows) over time at the vicinity of the MBH (through a spherical shell at R = [1, 3] pc) for different ISM phases in our Stellar Feedback simulations (see Table 2). For each run, the total cumulative net gas inflow (including all of the different ISM phases) is provided and indicated by a dashed black line. The growth of the MBH (solid black line for reference), in terms of percentage of the total cumulative net gas inflow, is provided and indicated by a dash-dotted black line. |
Figure 13 also clearly shows that the total amount of cumulative net gas inflow is significantly higher without SNII feedback (top row), compared to with SNII feedback (bottom row) included. The highest total cumulative net-inflow is achievable in the ISR-only feedback run (top right), followed by the no stellar feedback run (top left). For both runs the total cumulative net gas inflow is primarily driven by a strong net gas inflow of the CNM+CMM phase; however, for the ISR-only feedback run, a substantial net gas inflow of the UNM phase (and to some extent the WNM phase) can be seen as well (in agreement with Fig. 12, top right panel a and b). The same applies to the runs where SNII feedback is included; that is, with the cumulative net gas inflow of the CNM+CMM phase strongly suppressed, the cumulative net gas inflows of the UNM and WNM phases are of great importance to grow the MBH (in agreement with Partmann et al. 2025). Even though the overall gas accretion onto the MBH itself is suppressed by a lower total cumulative net gas inflow, compared to the no SNII feedback runs. The fraction of cumulative net gas inflow that does not contribute to the growth of the MBH is primarily lost in outflows (i.e. by either passing through or never entering the accretion region, r < racc, of the MBH).
Lastly, in Fig. 14 we check on the time evolution of the SFR (top row), the cumulative amount of stars formed (middle row), and the cumulative amount of energy injected into the ISM from SNII explosions (bottom row), in our Stellar Feedback simulations (different coloured lines), both on a global scale (R < 2.5 kpc, left column) and close to the MBH (R < 200 pc, right column). The SFR is the lowest when SNII feedback is combined with ISR feedback, resulting in the least amount of stars formed both on a global scale throughout the low-mass dwarf galaxy, and close to the MBH. Consequently, the cumulative amount of energy injected into the ISM from SNII explosions is also the smallest (on both scales). Based on our analysis above, where we show that nearby SNII explosions are able to suppress the gas accretion onto the MBH, this explains the slightly higher total cumulative net gas inflow and conversion factor in the SNII+ISR feedback run in Fig. 13 (bottom right), compared to the SNII-only feedback run (bottom left), and hence the slight increase in MBH growth seen in Fig. 3 (red curve). For the runs without SNII feedback included, the SFR is by far the highest in the no stellar feedback run, while in the ISR-only feedback run, it is instead comparable or slightly higher than in the SNII-only feedback run (in agreement with e.g. Rosdahl et al. 2015). The risk of depleting the gas via star formation is therefore significantly higher when no stellar feedback is considered (depletion timescale of ∼1 Gyr), compared to when SNII and/or ISR feedback is included (depletion timescales of ≳10 Gyr). Thus, in the ISR-only feedback run, the larger gas content (due to the longer depletion time compared to the no stellar feedback run) is most likely a contributing factor to the higher total cumulative net gas inflow seen in Fig. 13, making the MBH grow the most among all our Stellar Feedback simulations.
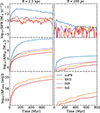 |
Fig. 14. Time evolution of the SFR (in bins of 10 Myr, top row), cumulative amount of stars formed (middle row), and cumulative amount of energy injected into the ISM from SNII explosions (bottom row), on a global scale (R < 2.5 kpc, left column) and close to the MBH (R < 200 pc, right column), in our Stellar Feedback simulations (see Table 2). |
3.4. Gas accretion onto under- and overmassive black holes
Based on our analysis above, SNII feedback seems to be the limiting factor in regulating MBH growth. To assess the validity of this for MBHs of different initial masses, in Fig. 15, we show the amount of mass accreted over time by an initial under- and overmassive BH (103 and 105 M⊙, respectively), assuming the MBH4_SNII simulation of an initial 104 M⊙ MBH to be a reference point. To spare the computational cost, ISR feedback is not considered, since it only marginally boosts the gas accretion onto the MBH when combined with SNII feedback (according to our analysis in Sect. 3.1)7. The initial 105 M⊙ MBH does not only accrete more mass compared to our initial 104 M⊙ MBH, but also grows more with respect to its initial mass (> 130% compared to ∼5% for our initial 104 M⊙ MBH). The opposite can be seen for the initial 103 M⊙ MBH, which accretes < 1 M⊙ (corresponding to only ∼0.04% of its initial mass). Hence, SNII feedback seems to be more effective in suppressing gas accretion the lower the MBH initial mass is (due to the weaker gravitational potential).
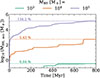 |
Fig. 15. Amount of mass accreted over time by MBHs of different initial masses. For the initial 104 M⊙ MBH, the MBH4_SNII is displayed, while for the initial 103 M⊙ and 105 M⊙ MBHs, the MBH3 and MBH5 simulations in the Black Hole Mass subset (see Table 2) are, respectively, shown. Dashed coloured lines indicate the percentage growth of each MBH (with respect to their initial masses). |
In Fig. 16, we show the fraction of time spent accreting at various Eddington fractions for each MBH of different initial masses in Fig. 15. The distribution of Eddington fractions are distinctly different between the runs, with for example only the initial 105 M⊙ MBH peaking in the radiatively efficient regime (fEdd > 0.02). As the initial mass of the MBH decreases, so does the peak of the distribution. For the initial 103 M⊙ MBH, this goes to the extreme with fEdd ∼ 10−5, completely halting the growth of the MBH as seen in Fig. 15.
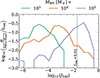 |
Fig. 16. Fraction of time spent at various Eddington fractions (fEdd = ṀBH/ṀEdd) for MBHs of different initial masses (same simulations as in Fig. 15). As a reference, the limit for the radiatively efficient regime fEdd = 0.02 (see Sect. 2.4.1 for more details) is indicated by a dashed black line. |
4. Discussion
Having shown in Sect. 3 our main results from the NOCTUA suite of simulations, in this section we continue by discussing the numerical caveats of our study (Sect. 4.1), and present the results on MBH growth when artificial gas inflows are induced, mimicking the effect of strong gas inflows potentially happening in a cosmological setting (Sect. 4.2). We then contextualise our results to the study of Partmann et al. (2025), at present the only comparable study to our work, and discuss the implications it may have for MBH growth in the low-mass dwarf galaxy regime (Sect. 4.3).
4.1. Simulation caveats
4.1.1. Resolution
One of the major limitations when simulating the physical interplay between MBHs and their host galaxies, is the extreme dynamical range required. Trying to resolve the gas accretion flow from galactic scales (several kpc), all the way down to the Schwarzschild radius of a 104 M⊙ MBH (∼10−9 pc), is computationally infeasible at the moment. That said, some studies try to overcome this via ‘hyper-refinement techniques’ (Hopkins et al. 2024), but at the expense of only being able to simulate SMBHs (∼107 M⊙) for ∼104 yr at the highest spatial resolution (10−5 − 10−4 pc). However, for the purpose of this study, where a time evolution of at least a few hundred million years is needed to properly investigate the impact of stellar feedback on MBH growth, a sub-grid treatment for the gas accretion onto the MBH below the resolution limit is therefore still needed.
In our adopted MBH gas accretion model (see Sect. 2.4), the MBH is only allowed to skim mass of individual gas cells inside its accretion radius racc. At smaller scales, the dynamics of the gas is too uncertain to accurately follow the gas inflow towards the MBH. The value of racc is thus essentially determined by the highest spatial resolution achievable for a resolved gas accretion flow onto the MBH. With a target gas mass resolution of 20 M⊙ and sub-parsec maximum spatial resolution (see Fig. B.1), racc is therefore set to 1 pc throughout the full suite. At this scale, the gas accretion onto the MBH is well converged (as demonstrated in Fig. B.2), and agrees well with Partmann et al. (2025), who despite using a different hydrodynamic and physical framework, also find convergence at ≤1 pc for MBH accretion in a similar dwarf galaxy set-up.
Even though the dedicated refinement strategy adopted in Sect. 2.4.2 ensures that the accretion region (r < racc) of the MBH is always resolved by a few tens of gas cells, the global target mass of gas cells can still influence the gas accretion onto the MBH – either via gas inflows from galactic scales, or indirectly via star formation and stellar feedback. Nevertheless, our resolution study presented in Fig. B.3, illustrates that a target gas mass of 20 M⊙ is enough to reach convergence for MBH growth (at least in the current numerical framework).
4.1.2. Black hole physics
Since the main purpose of this work is to study MBH growth in the presence of stellar feedback due to SNII explosions and ISR from OB stars, no feedback from the MBH is considered (this is instead deferred to a forthcoming study). The obtained gas accretion rate in each simulation should therefore be treated as an ‘upper limit’ on how much the MBH can potentially grow in that respective set-up.
We note that our sub-grid model for gas accretion onto the MBH is a simplified version of reality. For the radiatively efficient regime (fEdd > 0.02), the time for which gas is transported from the accretion radius racc down to the circularisation radius rcirc is most likely more complex than assuming a free-fall timescale. However, it could be argued that this is compensated by allowing rcirc to vary with the angular momentum of the infalling gas (and by such increasing or decreasing the viscous timescale in Eq. (7)), but this introduces other uncertainties, such as the efficiency factor for angular momentum transport between racc and rcirc (see Appendix A for more details). In addition to that, no time-lag effects are considered at all for the radiatively inefficient regime (fEdd < 0.02). Koudmani et al. (2024) recently presented an ‘unified’ accretion disc model where the unresolved gas accretion disc of the MBH is explicitly modelled for the radiatively inefficient regime in great detail. While it would be certainly interesting to investigate by how much such a detailed gas accretion scheme compares to our results, this clearly goes beyond the scope of our study. We speculate though that our main results regarding how stellar feedback impacts the gas inflow towards the MBH would hardly change, since a more detailed sub-grid accretion scheme most seemingly would only delay the gas accretion, but not change the total amount of gas accreted by the MBH. This could, however, change with the inclusion of active galactic nucleus (AGN) feedback, which very likely also will be delayed in time (and adjusted in strength). During this time delay, existing gas structures from the accretion event may have time to evolve, suggesting that the anticipated AGN feedback might interact with the nearby gas in a sightly different way (compared to if the AGN feedback is instantaneously injected into the ISM), possibly boosting or suppressing further gas accretion onto the MBH.
How our MBH gas accretion model compares to other accretion models in the literature requires extensive analysis, going beyond the scope of this paper. However, it is worth noting in Fig. 15 that a 10-times-more-massive BH results in ∼100 times more accreted mass, suggesting that a Bondi-Hoyle-Lyttleton formalism (Hoyle & Lyttleton 1939; Bondi & Hoyle 1944; Bondi 1952) with its  scaling might be a good-enough approximation for MBH gas accretion. That said, all of this is most certainly very resolution dependent (see Appendix B for more details), and would require a detailed study similar to Negri & Volonteri (2017), in order to fully understand the similarities and discrepancies between our accretion model and a Bondi-Hoyle-Lyttleton accretion scheme. How this would change for different environments is also very uncertain, for instance, at the presence of a NSC (see e.g. Partmann et al. 2025), where more complex dynamics would worsen the Bondi-Hoyle-Lyttleton approximation.
4.1.3. Missing galaxy physics
In this section we discuss some of the missing physical processes in our low-mass dwarf galaxy set-up, starting with stellar feedback. Assuming that other early stellar feedback processes may have a similar effect on MBH growth as the ISR feedback (in e.g. enhancing the growth of the MBH compared to no stellar feedback; see Sect. 3.1), stellar winds could potentially therefore have a positive influence on MBH gas accretion (even though at 0.1 Z⊙ stellar winds are expected to be less significant than e.g. in the Milky Way). Not because of the additional injection of mass (our system is already very gas rich), but because of the early dispersion of giant molecular clouds, suppressing star formation and therefore the number of SNII (which we show in Sect. 3 is a strong suppressor of MBH growth). Other stellar feedback processes that may have an influence on the MBH gas accretion include: type Ia supernovae (even though the rate at which they occur in our low-mass dwarf galaxy model is expected to be very small due to the relatively low stellar mass content), cosmic rays (CR), and photoelectric heating (PE). In the current physical framework, PE is included as part of the spatially constant interstellar radiation field, and hence does not properly capture the effects close to regions of active star formation. Hu et al. (2017) recently demonstrated that spatially and temporally varying PE heating alone can be as efficient as SNII in suppressing star formation, and would thus be interesting to further explore, but in the context of MBH gas accretion. Since radiation pressure is not included in the current implementation of ISR feedback (see Sect. 2.3.2 for more details), this also opens up an additional feedback channel potentially important for regulating MBH growth. To address some of these missing aspects, we aim to conduct an additional suite of simulations, where for example the impact of CRs on MBH gas accretion is investigated. Farcy et al. (2022) find that CRs can reduce the SFR in simulated dwarf galaxies (as well as the clumpiness of star formation), which based on our analysis in Sect. 3, would naively favour further MBH growth (due to a lower rate of SNII explosions). That said, CRs might also be able to drive cold gas out from the galaxy, and thus reduce the gas accretion onto the MBH.
We also note that magnetic fields are not included in our suite of simulations. On a global scale, Whitworth et al. (2023) find that magnetic fields in low-metallicity dwarf galaxies are unable to suppress star formation; thus, based on our analysis in Sect. 3, we do not expect magnetic fields to have any significant effect on the MBH gas accretion. However, magnetic fields may be able to remove angular momentum from the inflowing gas and deposit it further out, enhancing further MBH growth. On smaller scales, magnetic fields are expected to be more important, due to the magnetic field pressure stabilising the gas from collapsing, hindering star formation. This is especially true as we get close to the accretion disc of the MBH (Hopkins et al. 2024), but this is far from achievable in the simulations of this work. Still, to investigate the role of magnetic fields in MBH gas accretion (in the low-mass dwarf galaxy regime), we aim to conduct high-resolution radiation-magneto-hydrodynamic simulations in a future study.
4.1.4. The dwarf galaxy environment
The simulations of our low-mass dwarf galaxy system were conducted in an isolated environment, allowing us to run multiple high-resolution simulations of various physical set-ups (due to their relatively low computational cost compared to cosmological runs), isolate the internal physical processes of the low-mass dwarf galaxy from external events, and study their individual and cumulative impact on MBH gas accretion. However, by construction, then, the system lacks the cosmic environment needed for continuous gas inflows from the cosmic web, dynamical interactions with other galaxies, and mergers between BHs. Even though it remains unclear, these missing processes could be of great importance for MBH growth, especially at high redshift. For instance, by the use of cosmological zoom-in simulations, a handful of recent studies have been able to infer sustained super-Eddington gas accretion onto MBHs of 104−5 M⊙ at high redshift (z ≳ 7), growing the MBH by several orders of magnitudes in less than a few hundred million years (see e.g. Lupi et al. 2024; Huško et al. 2025)8, but typically in more massive systems than our simulated low-mass dwarf galaxy. That said, idealised custom-made simulations (with varying resolution) of giant molecular clouds (Shi et al. 2023), and extremely gas-rich low-mass galaxies (Mehta et al. 2024), both meant to represent possible high-redshift environments, have also been able demonstrate substantial MBH growth, enabling BH seeds of ∼1 − 104 M⊙ to even grow into SMBHs. But only for a limited time evolution of ≤10 Myr, not enough to fully capture the impact of stellar feedback on MBH growth, and without any feedback from the BHs themselves.
4.2. The effect of artificially induced gas inflows on massive black hole growth
To explore the effect of substantial gas inflows potentially happening in a cosmological setting (especially at high redshift) on MBH growth, for example by continuous gas inflows from the cosmic web or galaxy mergers (see e.g. Mayer & Bonoli 2019; Zwick et al. 2023; Mayer et al. 2024), we conducted a subset of simulations where the angular momentum of the gas is uniformly reduced by a certain percentage, Lreduce, across the gaseous disc of the low-mass dwarf galaxy (i.e. the ‘Artificial Inflows’ simulations in Table 2). In Fig. 17, we show the amount of mass accreted over time by an initial 104 M⊙ MBH (orange lines) when Lreduce is equal to 20 and 50% (dashed and dotted line, respectively), and compare this to our fiducial set-up where Lreduce = 0%, more specifically, the MBH4_SNII simulation in Table 2 (ISR feedback is not considered). As is illustrated in both Figs. 3 and 15, the change in MBH growth for different physical set-ups is typically already clearly visible in the first few 100 Myr. To save computational time, we therefore only ran our simulations of artificial gas inflows in Fig. 17 for 300 Myr. No clear difference in MBH growth can be seen for the initial 104 M⊙ MBH, with only marginally less mass accreted when Lreduce = 50%. We explain this via an increased SFR in the galactic centre (in agreement with e.g. Williamson et al. 2016), subsequently boosting the number of SNII occurring, suppressing the gas accretion onto the MBH despite the substantial gas inflow. A similar pair of simulations for an initial 106 M⊙ MBH with and without Lreduce = 20% was conducted as well. As was expected, the MBH of 106 M⊙ grows substantially more than its 104 M⊙ counterpart, but once again without any clear difference between the runs with and without artificial inflows. This suggests that the gravitational potential around the MBH is most vital in determining the gas accretion, while larger-scale inflows seem to be of minor importance. However, we want to emphasise that these simulations are a numerical experiment, and that the impact of gas inflows in a cosmic environment most likely is more nuanced. We therefore defer a more in-depth investigation of this to a future study.
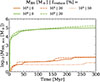 |
Fig. 17. Amount of mass accreted over time for an initial 104 M⊙ MBH (orange lines) with and without uniformly reducing the angular momentum of the gas in the low-mass dwarf galaxy by 20 and 50% (MBH4_L20 and MBH4_L50 in Table 2, respectively). No ISR feedback is considered. The simulation of an initial 104 M⊙ MBH with Lreduce = 0% corresponds to the MBH4_SNII simulation (see Table 2). A pair of simulations of an initial 106 M⊙ MBH (green lines) with and without Lreduce = 20% is also conducted (MBH6_L20 and MBH6 in Table 2, respectively). |
4.3. Comparison to Partmann et al. (2025)
The most comparable study to our work is Partmann et al. (2025), and their study on the importance of NSCs for MBH growth in the low-mass dwarf galaxy regime. Both their and our low-mass dwarf galaxy are very comparable in mass, but with the difference that Partmann et al. (2025) already have a pre-defined stellar disc in their initial conditions. However, despite this difference, and that fact that they are using a different hydrodynamic and physical framework, our results agree remarkably well. For instance, an initial 104 M⊙ MBH grows ∼30 − 40% of its initial mass in 600 Myr (without a NSC) in their study, which is slightly less but still very comparable to our initial 104 M⊙ MBH in the MBH4_full simulation (see Fig. 3). Partmann et al. (2025) also find that the gas accretion onto the MBH is episodic over time, composed of both warm and cold gas, and strongly regulated by nearby SNII explosions. Moreover, they also find that lower-mass MBHs (102−3 M⊙) cannot grow in the absence of an NSC, and that only a higher-mass MBH (105 M⊙) can accrete larger amount of gas. This agrees very well with our results from Sect. 3.4. That said, we note that our initial 105 M⊙ MBH grows more than in the equivalent set-up of Partmann et al. (2025) (> 100% compared to ∼10%, respectively). We speculate that this discrepancy could be due to a higher SFR at the centre of the dwarf galaxy simulated by Partmann et al. (2025), possibly due to the higher gas mass resolution (4 versus 20 M⊙ in our work) and the different star formation prescription adopted, and thus a higher number of nearby SNII explosions, hindering gas accretion onto the MBH. Regardless, the overall conclusions of both studies remain the same; that is, it is primarily the nearby gravitational potential around the MBH (either from an NSC or directly from an overmassive BH) that determines whether or not a MBH can grow via gas accretion over time (at least in an isolated low-mass dwarf galaxy environment).
5. Conclusions
We conducted a suite of high-resolution radiation-hydrodynamic simulations of MBH gas accretion in a low-mass dwarf galaxy, which we term the NOCTUA suite of simulations. These were carried out by introducing and applying the AREPONOCTUA numerical framework, whereby the chemical evolution of the gas was explicitly modelled in a time-dependent non-equilibrium way. As part of this framework, we developed and applied a novel physically motivated model for BH gas accretion, taking into account the angular momentum of the gas in the radiatively efficient regime, to estimate the gas accretion rate from the sub-grid accretion disc onto the MBH. We then studied the individual and cumulative impact of stellar feedback on the growth of an initial 104 M⊙ MBH, by gradually adding stellar feedback processes to the numerical set-up. This included individually traced SNII explosions, and radiatively transferred (on-the-fly) ISR from OB stars. Furthermore, we explored the influence of the initial MBH mass (103−6 M⊙) on the gas accretion, and whether or not artificially induced gas inflows (mimicking strong gas inflows potentially happening in a cosmological setting and possibly at high redshift) can boost the gas accretion onto the MBH. Our main findings are as follows:
-
Without any stellar feedback, a large mass fraction of the ISM resides in the cold neutral- and molecular medium (CNM+CMM) phases. This mass fraction increases as we move radially inwards towards the centre of the low-mass dwarf galaxy and the MBH. There, a high cumulative net gas inflow of the CNM+CMM phase enables the MBH to grow at a steady rate, roughly doubling its initial mass after 800 Myr.
-
With only ISR feedback, the SFR of the low-mass dwarf galaxy drops to the same level as (or slightly above) that when SNII feedback is considered. Besides an overall higher total cumulative net gas inflow, primarily driven by the CNM+CMM phase, substantial net gas inflows of the unstable and warm neutral medium (UNM and WNM, respectively) phases also contribute to the growth of the MBH. This allows the MBH to grow at a faster rate than in the no stellar feedback run, reaching a final mass of around five times its initial mass after 800 Myr. This is the fastest rate of growth found in any of our simulations of an initial 104 M⊙ MBH.
-
With only SNII feedback, the growth of the MBH is suppressed by more than an order of magnitude compared to the no stellar feedback run. By including SNII feedback, the mass fraction of the WNM phase increases throughout the entire low-mass dwarf galaxy, at the expense mainly of the CNM+CMM phase (compared to when no SNII feedback is included). The energy injection from nearby SNII explosions disrupts the gas inflow towards the MBH, making the gravitational binding energy of the gas comparable to or smaller than that of its thermal and kinetic energy. Thus, the likelihood is reduced of the inflowing gas fulfilling the accretion criteria of the MBH; that is, being gravitationally bound to the MBH and having a converging flow. Consequently, the gas inflow, and therefore the MBH gas accretion rate, is more episodic over time, regulated by either a few very nearby (10 s of pc) SNII explosions, or a high number of relatively nearby (∼100 − 200 pc) SNII events.
-
When SNII is combined with ISR feedback, the growth of the MBH remains suppressed compared to the no stellar feedback run. However, compared to the SNII-only feedback run, the MBH grows slightly more rapidly. This is due to the suppression of star formation by the early radiative feedback, leading to a lower rate of SNII explosions, enabling a higher total cumulative net gas inflow onto the MBH, and a higher probability of the inflowing gas being gravitationally bound and having a converging flow.
-
Taking the 104 M⊙ MBH as a reference point, we find that an overmassive BH of 105 M⊙ grows more in terms of both the total amount of mass accreted and its initial mass. On the other hand, the opposite is found for an undermassive BH of 103 M⊙, which is barely able to grow at all within a time period of 800 Myr.
-
Lastly, we find that artificially induced gas inflows towards the centre of the low-mass dwarf galaxy are unable to boost further gas accretion onto the MBH, even for a 106 M⊙ MBH. This suggests that it is primarily the nearby gravitational potential around the MBH that determines how much the MBH can grow via gas accretion over time, in the presence of SNII feedback (at least in an isolated non-cosmological environment).
We note that this work is the first in an upcoming series of studies, aiming to get a deeper understanding of BH growth over cosmic time. Even though our simulated low-mass dwarf galaxy is not meant to represent the conditions expected at high redshift, it still provides valuable information on what environments and/or physical processes at high redshift might be more or less favourable for MBH growth. With this knowledge, in future works we aim to extend the NOCTUA numerical framework and conduct high-resolution cosmological zoom-in simulations of BHs in (low-mass) galaxies. We also plan to include and investigate the impact of AGN winds (Farcy et al. 2025) and radiation on MBH growth at early epochs, as well as to accurately model emission lines, not only from HII regions around young star clusters but also from resolved narrow-line regions around BHs, to enable a meaningful comparison with spectroscopic observations such as ones from the James Webb Space Telescope (going beyond previous studies of Hirschmann et al. 2017, 2019, 2023).
Named after the ‘little owl’ – Athene Noctua, commonly adopted as a symbol for knowledge and wisdom, and where Noctua is associated with the Latin word for ‘night’.
We post-process each simulation snapshot for ∼5 × 10⁴ yr (with 5 SWEEP iterations over the full domain), enough to update the ionisation state of the gas, but short enough to avoid hydrodynamical effects that could happen on the fly (e.g. shocks).
Inferred observationally from the transition between the hard and soft state in BH X-ray binaries (McClintock & Remillard 2006). In the equation for  , where mp is the proton mass, σT is the Thomson cross section and c the speed of light, we assume a radiative efficiency of ϵr = 0.1 (Inayoshi et al. 2020).
This indirectly assumes that all gas skimmed by the MBH has a relatively low specific angular momentum, which is most likely not always true. However, for the purpose of this paper, the free-fall timescale is a sufficient approximation. Trying to constrain the timescale(s) on which gas is transported from racc down to rcirc is beyond the scope of this paper, but presents a potential topic for future work.
Feedback from the MBH will instead be considered and studied in an upcoming dedicated paper, following the study of Farcy et al. (2025).
The UNM phase is not primarily considered, since the mass fraction profiles are only marginally different between the runs. The drop in mass fraction for the UNM phase in the no stellar feedback run (blue curve) is due to the extreme increase in mass fraction of the CNM+CMM phase (see the blue curve in the bottom panel of the CNM+CMM column in Fig. 10).
We note that the gas accretion onto an undermassive BH with a shallower potential well might be more easily affected by early stellar feedback processes, than onto an overmassive BH with a deeper potential well. However, this type of parameter exploration goes beyond the scope of this paper; therefore, we leave it for a future study instead.
However, see also Massonneau et al. (2023), who is able to demonstrate super-Eddington gas accretion onto a 106 M⊙ MBH in an isolated low-mass galaxy at redshift z = 4.
Conducted in a low DM resolution set-up of our low-mass dwarf galaxy system presented in Table 1, with a MBH of MBH = 104 M⊙ and racc = 1 pc.
Only the amount of mass accreted on a grid level is considered (to avoid the risk of confusion when taking into account the many different steps of the sub-grid accretion model in Sect. 2.4.1).
Acknowledgments
We thank the anonymous referee for their comments on how to improve this manuscript. The simulations presented in this work have been performed on the Jed supercomputer, hosted by SCITAS at EPFL (Lausanne, Switzerland). JP credits Patrick Hirling (Institute of Physics, EPFL) and Darwin Roduit (Department of Astronomy, University of Geneva) for the name NOCTUA. JP thanks Chang-Goo Kim (Department of Astrophysical Sciences, Princeton University) for valuable feedback on the analysis, as well as Feng Yuan (Center for Astronomy and Astrophysics, Fudan University) and Yaping Li (Shanghai Astronomical Observatory, CAS) for sharing their insight on BH gas accretion theory. JP, MH and MF acknowledge funding from the Swiss National Science Foundation (SNF) via a PRIMA grant PR00P2 193577 ‘From cosmic dawn to high noon: the role of BHs for young galaxies’. SCOG, RSK and DJW acknowledge funding from the European Research Council via the ERC Synergy Grant “ECOGAL” (project ID 855130) and from the German Excellence Strategy via the Heidelberg Cluster of Excellence “STRUCTURES” (EXC 2181 – 390900948). RSK also thanks for support from the German Ministry for Economic Affairs and Climate Action in project “MAINN” (funding ID 50OO2206). RSK is grateful for computing resources provided by the Ministry of Science, Research and the Arts (MWK) of the State of Baden-Württemberg through bwHPC and the German Science Foundation (DFG) through grants INST 35/1134-1 FUGG and 35/1597-1 FUGG, and also for data storage at SDS@hd funded through grants INST 35/1314-1 FUGG and INST 35/1503-1 FUGG. In addition, RSK thanks the Harvard-Smithsonian Center for Astrophysics and the Radcliffe Institute for Advanced Studies for their hospitality during his sabbatical, and the 2024/25 Class of Radcliffe Fellows for highly interesting and stimulating discussions. TN acknowledges support from the Deutsche Forschungsgemeinschaft (DFG, German Research Foundation) under Germany’s Excellence Strategy – EXC-2094 – 390783311 from the DFG Cluster of Excellence “ORIGINS”. DJW acknowledges support from the Programa de Becas Posdoctorales of the Dirección General de Asuntos del Personal Académico of the Universidad Nacional Autónoma de México (DGAPA, UNAM, Mexico).
References
- Agertz, O., Pontzen, A., Read, J. I., et al. 2020, MNRAS, 491, 1656 [Google Scholar]
- Andersson, E. P., Agertz, O., Renaud, F., & Teyssier, R. 2023, MNRAS, 521, 2196 [NASA ADS] [CrossRef] [Google Scholar]
- Andika, I. T., Jahnke, K., Onoue, M., et al. 2020, ApJ, 903, 34 [Google Scholar]
- Anglés-Alcázar, D., Özel, F., Davé, R., et al. 2015, ApJ, 800, 127 [CrossRef] [Google Scholar]
- Asplund, M., Grevesse, N., Sauval, A. J., & Scott, P. 2009, ARA&A, 47, 481 [NASA ADS] [CrossRef] [Google Scholar]
- Baldassare, V. F., Reines, A. E., Gallo, E., & Greene, J. E. 2017, ApJ, 836, 20 [NASA ADS] [CrossRef] [Google Scholar]
- Baldassare, V. F., Geha, M., & Greene, J. 2018, ApJ, 868, 152 [NASA ADS] [CrossRef] [Google Scholar]
- Baldassare, V. F., Geha, M., & Greene, J. 2020, ApJ, 896, 10 [NASA ADS] [CrossRef] [Google Scholar]
- Bañados, E., Schindler, J.-T., Venemans, B. P., et al. 2023, ApJS, 265, 29 [CrossRef] [Google Scholar]
- Barai, P., & de Gouveia Dal Pino, E. M. 2019, MNRAS, 487, 5549 [NASA ADS] [CrossRef] [Google Scholar]
- Bellovary, J., Brooks, A., Volonteri, M., et al. 2013, ApJ, 779, 136 [Google Scholar]
- Bertram, E., Glover, S. C. O., Clark, P. C., & Klessen, R. S. 2015, MNRAS, 451, 3679 [Google Scholar]
- Bondi, H. 1952, MNRAS, 112, 195 [Google Scholar]
- Bondi, H., & Hoyle, F. 1944, MNRAS, 104, 273 [Google Scholar]
- Booth, C. M., & Schaye, J. 2009, MNRAS, 398, 53 [Google Scholar]
- Bu, D.-F., & Yuan, F. 2014, MNRAS, 442, 917 [Google Scholar]
- Choi, E., Ostriker, J. P., Naab, T., Oser, L., & Moster, B. P. 2015, MNRAS, 449, 4105 [CrossRef] [Google Scholar]
- Ciotti, L., & Ostriker, J. P. 2007, ApJ, 665, 1038 [NASA ADS] [CrossRef] [Google Scholar]
- Ciotti, L., Ostriker, J. P., & Proga, D. 2009, ApJ, 699, 89 [NASA ADS] [CrossRef] [Google Scholar]
- Ciotti, L., Pellegrini, S., Negri, A., & Ostriker, J. P. 2017, ApJ, 835, 15 [Google Scholar]
- Clark, P. C., Glover, S. C. O., & Klessen, R. S. 2012, MNRAS, 420, 745 [NASA ADS] [CrossRef] [Google Scholar]
- Deng, Y., Li, H., Liu, B., et al. 2024, A&A, 691, A231 [NASA ADS] [CrossRef] [EDP Sciences] [Google Scholar]
- Di Matteo, T., Colberg, J., Springel, V., Hernquist, L., & Sijacki, D. 2008, ApJ, 676, 33 [NASA ADS] [CrossRef] [Google Scholar]
- Draine, B. T. 1978, ApJS, 36, 595 [Google Scholar]
- Dubois, Y., Volonteri, M., Silk, J., et al. 2015, MNRAS, 452, 1502 [Google Scholar]
- Ekström, S., Georgy, C., Eggenberger, P., et al. 2012, A&A, 537, A146 [Google Scholar]
- Emerick, A., Bryan, G. L., & Mac Low, M.-M. 2018, ApJ, 865, L22 [NASA ADS] [CrossRef] [Google Scholar]
- Emerick, A., Bryan, G. L., & Mac Low, M.-M. 2019, MNRAS, 482, 1304 [NASA ADS] [CrossRef] [Google Scholar]
- Fabian, A. C. 2012, ARA&A, 50, 455 [Google Scholar]
- Farcy, M., Rosdahl, J., Dubois, Y., Blaizot, J., & Martin-Alvarez, S. 2022, MNRAS, 513, 5000 [NASA ADS] [CrossRef] [Google Scholar]
- Farcy, M., Hirschmann, M., Somerville, R. S., et al. 2025, MNRAS, 543, 967 [Google Scholar]
- Ferrière, K. M. 2001, Rev. Mod. Phys., 73, 1031 [NASA ADS] [CrossRef] [Google Scholar]
- Gan, Z., Yuan, F., Ostriker, J. P., Ciotti, L., & Novak, G. S. 2014, ApJ, 789, 150 [Google Scholar]
- Gaspari, M., Ruszkowski, M., & Oh, S. P. 2013, MNRAS, 432, 3401 [NASA ADS] [CrossRef] [Google Scholar]
- Gatto, A., Walch, S., Low, M. M. M., et al. 2015, MNRAS, 449, 1057 [NASA ADS] [CrossRef] [Google Scholar]
- Gloudemans, A. J., Duncan, K. J., Saxena, A., et al. 2022, A&A, 668, A27 [NASA ADS] [CrossRef] [EDP Sciences] [Google Scholar]
- Glover, S. C. O., & Clark, P. C. 2012, MNRAS, 421, 116 [NASA ADS] [Google Scholar]
- Glover, S. C. O., & Mac Low, M.-M. 2007a, ApJS, 169, 239 [NASA ADS] [CrossRef] [Google Scholar]
- Glover, S. C. O., & Mac Low, M.-M. 2007b, ApJ, 659, 1317 [NASA ADS] [CrossRef] [Google Scholar]
- Gnat, O., & Ferland, G. J. 2012, ApJS, 199, 20 [NASA ADS] [CrossRef] [Google Scholar]
- Goldsmith, P. F., & Langer, W. D. 1978, ApJ, 222, 881 [Google Scholar]
- Göller, J., Girichidis, P., Brucy, N., et al. 2025, A&A, in press, https://doi.org/10.1051/0004-6361/202452223 [Google Scholar]
- Graham, A. W., & Driver, S. P. 2007, ApJ, 655, 77 [NASA ADS] [CrossRef] [Google Scholar]
- Greene, J. E., Labbe, I., Goulding, A. D., et al. 2024, ApJ, 964, 39 [CrossRef] [Google Scholar]
- Gültekin, K., Richstone, D. O., Gebhardt, K., et al. 2009, ApJ, 698, 198 [Google Scholar]
- Gutcke, T. A., Pakmor, R., Naab, T., & Springel, V. 2021, MNRAS, 501, 5597 [NASA ADS] [Google Scholar]
- Habouzit, M., Volonteri, M., & Dubois, Y. 2017, MNRAS, 468, 3935 [NASA ADS] [CrossRef] [Google Scholar]
- Habouzit, M., Li, Y., Somerville, R. S., et al. 2021, MNRAS, 503, 1940 [NASA ADS] [CrossRef] [Google Scholar]
- Habouzit, M., Onoue, M., Bañados, E., et al. 2022, MNRAS, 511, 3751 [NASA ADS] [CrossRef] [Google Scholar]
- Harikane, Y., Zhang, Y., Nakajima, K., et al. 2023, ApJ, 959, 39 [NASA ADS] [CrossRef] [Google Scholar]
- Häring, N., & Rix, H.-W. 2004, ApJ, 604, L89 [Google Scholar]
- Hernquist, L. 1990, ApJ, 356, 359 [Google Scholar]
- Hernquist, L., & Barnes, J. E. 1990, ApJ, 349, 562 [Google Scholar]
- Hirschmann, M., Khochfar, S., Burkert, A., et al. 2010, MNRAS, 407, 1016 [Google Scholar]
- Hirschmann, M., Dolag, K., Saro, A., et al. 2014, MNRAS, 442, 2304 [Google Scholar]
- Hirschmann, M., Charlot, S., Feltre, A., et al. 2017, MNRAS, 472, 2468 [NASA ADS] [CrossRef] [Google Scholar]
- Hirschmann, M., Charlot, S., Feltre, A., et al. 2019, MNRAS, 487, 333 [NASA ADS] [CrossRef] [Google Scholar]
- Hirschmann, M., Charlot, S., Feltre, A., et al. 2023, MNRAS, 526, 3610 [NASA ADS] [CrossRef] [Google Scholar]
- Hopkins, P. F., Grudic, M. Y., Su, K.-Y., et al. 2024, Open J. Astrophys., 7, 18 [NASA ADS] [Google Scholar]
- Hoyle, F., & Lyttleton, R. A. 1939, Proc. Camb. Philos. Soc., 35, 405 [CrossRef] [Google Scholar]
- Hu, C.-Y., Naab, T., Walch, S., Glover, S. C. O., & Clark, P. C. 2016, MNRAS, 458, 3528 [CrossRef] [Google Scholar]
- Hu, C.-Y., Naab, T., Glover, S. C. O., Walch, S., & Clark, P. C. 2017, MNRAS, 471, 2151 [NASA ADS] [CrossRef] [Google Scholar]
- Huško, F., Lacey, C. G., Roper, W. J., et al. 2025, MNRAS, 537, 2559 [Google Scholar]
- Inayoshi, K., Visbal, E., & Haiman, Z. 2020, ARA&A, 58, 27 [NASA ADS] [CrossRef] [Google Scholar]
- Jahnke, K., & Macciò, A. V. 2011, ApJ, 734, 92 [NASA ADS] [CrossRef] [Google Scholar]
- Jeans, J. H. 1902, Phil. Trans. Roy. Soc. London Ser. A, 199, 1 [CrossRef] [Google Scholar]
- Jiang, L., McGreer, I. D., Fan, X., et al. 2016, ApJ, 833, 222 [Google Scholar]
- Kato, S., Fukue, J., & Mineshige, S. 2008, Black-Hole Accretion Disks– Towards a New Paradigm (Kyoto: Kyoto University Press) [Google Scholar]
- Kim, Y., Im, M., Jeon, Y., et al. 2015, ApJ, 813, L35 [NASA ADS] [CrossRef] [Google Scholar]
- Kim, J.-G., Gong, M., Kim, C.-G., & Ostriker, E. C. 2023a, ApJS, 264, 10 [NASA ADS] [CrossRef] [Google Scholar]
- Kim, C.-G., Kim, J.-G., Gong, M., & Ostriker, E. C. 2023b, ApJ, 946, 3 [NASA ADS] [CrossRef] [Google Scholar]
- King, A. 2003, ApJ, 596, L27 [Google Scholar]
- Klessen, R. S., & Glover, S. C. O. 2016, Saas-Fee Advanced Course, 43, 85 [Google Scholar]
- Kocevski, D. D., Onoue, M., Inayoshi, K., et al. 2023, ApJ, 954, L4 [NASA ADS] [CrossRef] [Google Scholar]
- Kokorev, V., Fujimoto, S., Labbe, I., et al. 2023, ApJ, 957, L7 [NASA ADS] [CrossRef] [Google Scholar]
- Kormendy, J., & Ho, L. C. 2013, ARA&A, 51, 511 [Google Scholar]
- Koudmani, S., Sijacki, D., Bourne, M. A., & Smith, M. C. 2019, MNRAS, 484, 2047 [NASA ADS] [CrossRef] [Google Scholar]
- Koudmani, S., Henden, N. A., & Sijacki, D. 2021, MNRAS, 503, 3568 [CrossRef] [Google Scholar]
- Koudmani, S., Sijacki, D., & Smith, M. C. 2022, MNRAS, 516, 2112 [NASA ADS] [CrossRef] [Google Scholar]
- Koudmani, S., Somerville, R. S., Sijacki, D., et al. 2024, MNRAS, 532, 60 [Google Scholar]
- Kroupa, P. 2001, MNRAS, 322, 231 [NASA ADS] [CrossRef] [Google Scholar]
- Lahén, N., Naab, T., Johansson, P. H., et al. 2020, ApJ, 891, 2 [CrossRef] [Google Scholar]
- Larson, R. L., Finkelstein, S. L., Kocevski, D. D., et al. 2023, ApJ, 953, L29 [NASA ADS] [CrossRef] [Google Scholar]
- Lin, X., Wang, F., Fan, X., et al. 2024, ApJ, 974, 147 [NASA ADS] [CrossRef] [Google Scholar]
- Lupi, A., Quadri, G., Volonteri, M., Colpi, M., & Regan, J. A. 2024, A&A, 686, A256 [NASA ADS] [CrossRef] [EDP Sciences] [Google Scholar]
- Lynden-Bell, D. 1969, Nature, 223, 690 [NASA ADS] [CrossRef] [Google Scholar]
- Maeder, A. 2009, Physics, Formation and Evolution of Rotating Stars (Berlin, Heidelberg: Springer) [Google Scholar]
- Magorrian, J., Tremaine, S., Richstone, D., et al. 1998, AJ, 115, 2285 [Google Scholar]
- Maiolino, R., Scholtz, J., Curtis-Lake, E., et al. 2024, A&A, 691, A145 [NASA ADS] [CrossRef] [EDP Sciences] [Google Scholar]
- Maoz, D., & Mannucci, F. 2012, PASA, 29, 447 [NASA ADS] [CrossRef] [Google Scholar]
- Martizzi, D., Faucher-Giguère, C.-A., & Quataert, E. 2015, MNRAS, 450, 504 [NASA ADS] [CrossRef] [Google Scholar]
- Massonneau, W., Volonteri, M., Dubois, Y., & Beckmann, R. S. 2023, A&A, 670, A180 [NASA ADS] [CrossRef] [EDP Sciences] [Google Scholar]
- Matsuoka, Y., Onoue, M., Kashikawa, N., et al. 2016, ApJ, 828, 26 [Google Scholar]
- Matsuoka, Y., Iwasawa, K., Onoue, M., et al. 2018, ApJS, 237, 5 [Google Scholar]
- Matsuoka, Y., Onoue, M., Kashikawa, N., et al. 2019, ApJ, 872, L2 [Google Scholar]
- Matthee, J., Naidu, R. P., Brammer, G., et al. 2024, ApJ, 963, 129 [NASA ADS] [CrossRef] [Google Scholar]
- Mayer, L., & Bonoli, S. 2019, Rep. Progr. Phys., 82, 016901 [CrossRef] [Google Scholar]
- Mayer, L., Capelo, P. R., Zwick, L., & Di Matteo, T. 2024, ApJ, 961, 76 [NASA ADS] [CrossRef] [Google Scholar]
- McAlpine, S., Bower, R. G., Rosario, D. J., et al. 2018, MNRAS, 481, 3118 [NASA ADS] [CrossRef] [Google Scholar]
- McClintock, J. E., & Remillard, R. A. 2006, Compact Stellar X-ray Sources, 39, 157 [NASA ADS] [CrossRef] [Google Scholar]
- McConnell, N. J., & Ma, C.-P. 2013, ApJ, 764, 184 [Google Scholar]
- Mehta, D., Regan, J. A., & Prole, L. 2024, Open J. Astrophys., 7, 107 [Google Scholar]
- Mezcua, M. 2019, Nat. Astron., 3, 6 [Google Scholar]
- Mezcua, M., & Domínguez Sánchez, H. 2020, ApJ, 898, L30 [Google Scholar]
- Mezcua, M., Civano, F., Marchesi, S., et al. 2018, MNRAS, 478, 2576 [NASA ADS] [CrossRef] [Google Scholar]
- Mezcua, M., Suh, H., & Civano, F. 2019, MNRAS, 488, 685 [Google Scholar]
- Mezcua, M., Siudek, M., Suh, H., et al. 2023, ApJ, 943, L5 [NASA ADS] [CrossRef] [Google Scholar]
- Moran, E. C., Shahinyan, K., Sugarman, H. R., Vélez, D. O., & Eracleous, M. 2014, AJ, 148, 136 [NASA ADS] [CrossRef] [Google Scholar]
- Morgan, C. W., Kochanek, C. S., Morgan, N. D., & Falco, E. E. 2010, ApJ, 712, 1129 [Google Scholar]
- Mortlock, D. J., Patel, M., Warren, S. J., et al. 2009, A&A, 505, 97 [NASA ADS] [CrossRef] [EDP Sciences] [Google Scholar]
- Mortlock, D. J., Warren, S. J., Venemans, B. P., et al. 2011, Nature, 474, 616 [Google Scholar]
- Moster, B. P., Somerville, R. S., Maulbetsch, C., et al. 2010, ApJ, 710, 903 [Google Scholar]
- Moster, B. P., Naab, T., & White, S. D. M. 2013, MNRAS, 428, 3121 [Google Scholar]
- Naab, T., & Ostriker, J. P. 2017, ARA&A, 55, 59 [Google Scholar]
- Narayan, R., & Yi, I. 1995, ApJ, 452, 710 [NASA ADS] [CrossRef] [Google Scholar]
- Navarro, J. F., Frenk, C. S., & White, S. D. M. 1996, ApJ, 462, 563 [Google Scholar]
- Negri, A., & Volonteri, M. 2017, MNRAS, 467, 3475 [NASA ADS] [CrossRef] [Google Scholar]
- Nelson, R. P., & Langer, W. D. 1997, ApJ, 482, 796 [NASA ADS] [CrossRef] [Google Scholar]
- Nelson, D., Pillepich, A., Springel, V., et al. 2019, MNRAS, 490, 3234 [Google Scholar]
- Nguyen, D. D., Seth, A. C., Neumayer, N., et al. 2019, ApJ, 872, 104 [Google Scholar]
- Novak, G. S., Ostriker, J. P., & Ciotti, L. 2011, ApJ, 737, 26 [Google Scholar]
- Onoue, M., Inayoshi, K., Ding, X., et al. 2023, ApJ, 942, L17 [NASA ADS] [CrossRef] [Google Scholar]
- Pardo, K., Goulding, A. D., Greene, J. E., et al. 2016, ApJ, 831, 203 [NASA ADS] [CrossRef] [Google Scholar]
- Partmann, C., Naab, T., Lahén, N., et al. 2025, MNRAS, 537, 956 [Google Scholar]
- Peter, T., Klessen, R. S., Kanschat, G., Glover, S. C. O., & Bastian, P. 2023, MNRAS, 519, 4263 [CrossRef] [Google Scholar]
- Prieto, J., Escala, A., Volonteri, M., & Dubois, Y. 2017, ApJ, 836, 216 [NASA ADS] [CrossRef] [Google Scholar]
- Reed, S. L., McMahon, R. G., Martini, P., et al. 2017, MNRAS, 468, 4702 [NASA ADS] [CrossRef] [Google Scholar]
- Reed, S. L., Banerji, M., Becker, G. D., et al. 2019, MNRAS, 487, 1874 [Google Scholar]
- Reines, A. E., & Volonteri, M. 2015, ApJ, 813, 82 [NASA ADS] [CrossRef] [Google Scholar]
- Reines, A. E., Sivakoff, G. R., Johnson, K. E., & Brogan, C. L. 2011, Nature, 470, 66 [Google Scholar]
- Reines, A. E., Greene, J. E., & Geha, M. 2013, ApJ, 775, 116 [Google Scholar]
- Reines, A. E., Condon, J. J., Darling, J., & Greene, J. E. 2020, ApJ, 888, 36 [NASA ADS] [CrossRef] [Google Scholar]
- Rosas-Guevara, Y. M., Bower, R. G., Schaye, J., et al. 2015, MNRAS, 454, 1038 [NASA ADS] [CrossRef] [Google Scholar]
- Rosdahl, J., Schaye, J., Teyssier, R., & Agertz, O. 2015, MNRAS, 451, 34 [CrossRef] [Google Scholar]
- Sacchi, A., Bogdán, Á., Chadayammuri, U., & Ricarte, A. 2024, ApJ, 974, 14 [Google Scholar]
- Salpeter, E. E. 1964, ApJ, 140, 796 [NASA ADS] [CrossRef] [Google Scholar]
- Schaye, J., Crain, R. A., Bower, R. G., et al. 2015, MNRAS, 446, 521 [Google Scholar]
- Schutte, Z., Reines, A. E., & Greene, J. E. 2019, ApJ, 887, 245 [NASA ADS] [CrossRef] [Google Scholar]
- Shakura, N. I., & Sunyaev, R. A. 1973, A&A, 24, 337 [NASA ADS] [Google Scholar]
- Sharma, R. S., Brooks, A. M., Somerville, R. S., et al. 2020, ApJ, 897, 103 [NASA ADS] [CrossRef] [Google Scholar]
- Sharma, R. S., Brooks, A. M., Tremmel, M., et al. 2022, ApJ, 936, 82 [NASA ADS] [CrossRef] [Google Scholar]
- Shi, Y., Kremer, K., Grudić, M. Y., Gerling-Dunsmore, H. J., & Hopkins, P. F. 2023, MNRAS, 518, 3606 [Google Scholar]
- Sijacki, D., Vogelsberger, M., Genel, S., et al. 2015, MNRAS, 452, 575 [NASA ADS] [CrossRef] [Google Scholar]
- Silk, J., & Rees, M. J. 1998, A&A, 331, L1 [NASA ADS] [Google Scholar]
- Sivasankaran, A., Blecha, L., Torrey, P., et al. 2022, MNRAS, 517, 4752 [NASA ADS] [CrossRef] [Google Scholar]
- Smith, R. J., Glover, S. C. O., Clark, P. C., Klessen, R. S., & Springel, V. 2014, MNRAS, 441, 1628 [NASA ADS] [CrossRef] [Google Scholar]
- Smith, M. C., Bryan, G. L., Somerville, R. S., et al. 2021, MNRAS, 506, 3882 [NASA ADS] [CrossRef] [Google Scholar]
- Somerville, R. S., & Davé, R. 2015, ARA&A, 53, 51 [Google Scholar]
- Sormani, M. C., Treß, R. G., Klessen, R. S., & Glover, S. C. O. 2017, MNRAS, 466, 407 [NASA ADS] [CrossRef] [Google Scholar]
- Sormani, M. C., Treß, R. G., Ridley, M., et al. 2018, MNRAS, 475, 2383 [NASA ADS] [CrossRef] [Google Scholar]
- Sormani, M. C., Tress, R. G., Glover, S. C. O., et al. 2020, MNRAS, 497, 5024 [Google Scholar]
- Springel, V. 2005, MNRAS, 364, 1105 [Google Scholar]
- Springel, V. 2010, MNRAS, 401, 791 [Google Scholar]
- Springel, V., & Hernquist, L. 2003, MNRAS, 339, 289 [Google Scholar]
- Springel, V., Di Matteo, T., & Hernquist, L. 2005, MNRAS, 361, 776 [Google Scholar]
- Steinborn, L. K., Dolag, K., Hirschmann, M., Prieto, M. A., & Remus, R.-S. 2015, MNRAS, 448, 1504 [Google Scholar]
- Steinwandel, U. P., Kim, C.-G., Bryan, G. L., et al. 2024, ApJ, 960, 100 [NASA ADS] [CrossRef] [Google Scholar]
- Tartėnas, M., & Zubovas, K. 2022, MNRAS, 516, 2522 [CrossRef] [Google Scholar]
- Taylor, A. J., Finkelstein, S. L., Kocevski, D. D., et al. 2025, ApJ, 986, 165 [Google Scholar]
- Trebitsch, M., Volonteri, M., Dubois, Y., & Madau, P. 2018, MNRAS, 478, 5607 [NASA ADS] [CrossRef] [Google Scholar]
- Tremaine, S., Gebhardt, K., Bender, R., et al. 2002, ApJ, 574, 740 [NASA ADS] [CrossRef] [Google Scholar]
- Tress, R. G., Smith, R. J., Sormani, M. C., et al. 2020, MNRAS, 492, 2973 [Google Scholar]
- Tress, R. G., Sormani, M. C., Girichidis, P., et al. 2024, A&A, 691, A303 [NASA ADS] [CrossRef] [EDP Sciences] [Google Scholar]
- Truelove, J. K., Klein, R. I., McKee, C. F., et al. 1997, ApJ, 489, L179 [CrossRef] [Google Scholar]
- Übler, H., Maiolino, R., Curtis-Lake, E., et al. 2023, A&A, 677, A145 [NASA ADS] [CrossRef] [EDP Sciences] [Google Scholar]
- Volonteri, M., Dubois, Y., Pichon, C., & Devriendt, J. 2016, MNRAS, 460, 2979 [Google Scholar]
- Wang, F., Yang, J., Fan, X., et al. 2021, ApJ, 907, L1 [Google Scholar]
- Weinberger, R., Springel, V., Pakmor, R., et al. 2018, MNRAS, 479, 4056 [Google Scholar]
- Weinberger, R., Bhowmick, A., Blecha, L., et al. 2025, A&A, 700, A52 [NASA ADS] [CrossRef] [EDP Sciences] [Google Scholar]
- Whitworth, D. J., Smith, R. J., Tress, R., et al. 2022, MNRAS, 510, 4146 [NASA ADS] [CrossRef] [Google Scholar]
- Whitworth, D. J., Smith, R. J., Klessen, R. S., et al. 2023, MNRAS, 520, 89 [NASA ADS] [CrossRef] [Google Scholar]
- Williamson, D., Martel, H., & Romeo, A. B. 2016, ApJ, 831, 1 [NASA ADS] [CrossRef] [Google Scholar]
- Willott, C. J., Delorme, P., Reylé, C., et al. 2009, AJ, 137, 3541 [Google Scholar]
- Willott, C. J., Delorme, P., Reylé, C., et al. 2010, AJ, 139, 906 [Google Scholar]
- Yang, J., Wang, F., Fan, X., et al. 2020, ApJ, 897, L14 [Google Scholar]
- Yuan, F., Yoon, D., Li, Y.-P., et al. 2018, ApJ, 857, 121 [Google Scholar]
- Zwick, L., Mayer, L., Haemmerlé, L., & Klessen, R. S. 2023, MNRAS, 518, 2076 [Google Scholar]
Appendix A: Variable circularisation radius
The idea for a variable circularisation radius that is dependent on the specific angular momentum of the skimmed gas is inspired by the detailed one-dimensional accretion disc sub-grid model of Tartėnas & Zubovas (2022), where individual gas particles are placed in a sub-grid accretion disc at different radii depending on their specific angular momentum. For our study however, a simpler prescription is adopted.
Whenever an accretion event in the radiatively efficient regime (i.e. when ṀBH > 0.02 ṀEdd) occurs, the specific angular momentum transfer rate from the MBH accretion radius, racc, to the gas accretion disc is estimated as
 (A.1)
(A.1)
where ⟨Jin⟩ is the mass-weighted mean specific angular momentum of the newly skimmed gas, τff is the free-fall timescale from racc down to rcirc (same as in Eq. 6 in Sect. 2.4.1), and βff = 0.1 is an efficiency factor per free-fall timescale (whose value is discussed below). The expected circularisation radius of the newly skimmed gas follows as
 (A.2)
(A.2)
with Δt being the current timestep of the simulation. Since the MBH can already have an active accretion disc with a well-defined mass and size from a previous accretion event, the circularisation radius rcirc is updated by taking the mass-weighted mean value as its new value:
 (A.3)
(A.3)
where Mdg is the mass of the accretion disc and Min is the mass of the newly skimmed gas.
The need for an efficiency factor per free-fall time (βff in Eq. A.1) is apparent from the top panel in Fig. A.1, in which the time evolution of rcirc for a set of simulations9 of different βff values are shown. By comparing the time evolution of rcirc with the observational scaling relation of Morgan et al. (2010) and the theoretical prediction for a thin disc (obtained from Eq. 9 in Koudmani et al. 2024), it is evident that no βff correction at all over-estimates rcirc, while βff = 0.1 agrees the most with both observational and theoretical constraints.
By modelling the efficiency factor βff to be per free-fall time, the expectation is that the time evolution of rcirc should fall within a similar range irrespective of racc and/or MBH. To assess this, the time evolution of rcirc for increasing values of racc (with and without βff = 0.1) is shown in the middle panel of Fig. A.1. In the bottom panel of Fig. A.1, a similar assessment is done, but for different values of MBH. Both panels agree with the expected outcome; however, in the case of MBH = 105 M⊙ (right panel), rcirc is able to evolve inside the upper theoretical prediction without βff = 0.1. This suggests that as the free-fall time gets shorter (by increasing MBH and/or potentially by decreasing racc), the βff parameter will at some point be redundant. Finding the convergence point is beyond the scope of this paper (but a potential topic for future work). Instead, based on the results of Fig. A.1, a value of βff = 0.1 is concluded to be sufficient for the purpose of this study (and unless mentioned otherwise the assumed value for all of the simulations in this work).
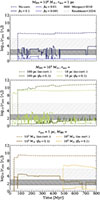 |
Fig. A.1. Time evolution of rcirc in a set of simulations conducted in a low DM resolution set-up of our low-mass dwarf galaxy (see Table 1). Top: The efficiency factor βff (see Eq. A.1) is introduced and varied between 0.1 and 0.001 for a MBH of MBH = 104 M⊙ and racc = 1 pc. The shaded dark grey area corresponds to the observational scaling relation of Morgan et al. (2010), while the shaded light grey area represents the theoretical range for a 101−3 M⊙ thin disc (Eq. 9 in Koudmani et al. 2024). Middle: For a MBH of MBH = 104 M⊙, racc is varied between 100 and 10 pc, with and without βff = 0.1. Bottom: With racc = 1 pc, the initial mass MBH of the MBH is varied between 103 and 105 M⊙, with and without βff = 0.1. |
Appendix B: Resolution study
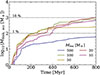 |
Fig. B.3. Amount of mass accreted over time by an initial 104 M⊙ MBH sink particle for different values of the global target mass, Mres, of gas cells. For comparison, dashed black lines mark the percentage growth of the MBH (with respect to its initial mass) |
With the numerical set-up described in Sect. 2, two parameters essentially determine the gas resolution in our simulations. These are the global target mass Mres of the gas cells, and the MBH accretion radius, racc. There is also the refinement radius rref around the MBH, but since the maximum volume limit of the gas cells inside rref is directly coupled to the size of racc (see Sect. 2.4.2 for more details), and rref is kept fixed at 10 pc in all of our simulations, we do not expected rref to be as essential for the gas accretion onto the MBH as racc. To get an understanding of how influential the gas resolution is to the growth of the MBH, a resolution study is conducted. The study is made for a MBH of MBH = 104 M⊙ in a low DM resolution set-up of the low-mass dwarf galaxy system presented in Table 1. For every simulation making up the study, Fig. B.1 shows how the spatial resolution of the gas cells (as function of gas density) changes with the choice of values for racc and Mres. As AREPO favours quasi-spherical gas cells, the radius rcell of a sphere is an adequate representation of the typical size of a gas cell given its volume.
By gradually reducing racc from 100 to 1 pc (while Mres = 100 M⊙), the gas resolution at the vicinity of the MBH increases (due to the refinement strategy adopted in Sect. 2.4.2 ensuring that at least a few tens of gas cells are always resolved inside racc). The two emerging vertical regions below the main bulk of gas in Fig. B.1 correspond to the geometrical refinement inside rref and racc, respectively. As racc decreases, the gas cells populating these regions reduce in size, i.e. the spatial resolution increases. Figure B.2 shows the amount of mass accreted over time by the MBH sink particle10 for different values of racc. To get an idea how volatile the growth of the MBH sink particle is to stochastic processes (e.g. star formation), the simulations of racc that were equal to 10 and 1 pc were run a second time. A simulation of Bondi accretion (Bondi 1952) was also conducted. Within this accretion scheme, Eq. (4) in Sect. 2.4 is replaced by
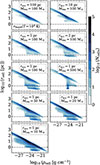 |
Fig. B.1. Typical size of gas cells as a function of gas density (at t ∼ 300 Myr) in all of the simulations making up the resolution study. The characteristic length scale of Bondi accretion rBondi = 2GMBH/cs2 for a 104 M⊙ MBH in T = 104 K gas is indicated by a dash-dotted black line. The two horizontal regions emerging as racc decreases corresponds to the geometrical refinement strategy inside rref and racc, respectively, adopted in Sect. 2.4.2. |
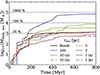 |
Fig. B.2. Amount of mass accreted over time by an initial 104 M⊙ MBH sink particle for different values of racc, with two simulations run when racc is equal to 10 and 1 pc, respectively (to check how volatile the growth of the MBH sink particle is to stochastic processes). A simulation of Bondi accretion is also conducted, where racc = max(1 pc, rBondi). Dashed black lines indicate the percentage growth of the MBH (with respect to its initial mass). |
 (B.1)
(B.1)
where ρ and cs are the non-weighted mean density and mean sound speed, respectively, of all the gas cells inside racc. The recipe to skim mass of individual gas cells remains the same (see Eq. 5), except that it is now volume-weighted. With the high spatial resolution achievable in the simulations of this work, the characteristic length scale rBondi = 2GMBH/cs2 of Bondi accretion is partly resolved (up to T = 104 K; see Fig. B.1). Therefore, racc is allowed to vary on the fly according to racc = max(1 pc, rBondi) (the computational cost of a resolved accretion region when racc < 1 pc is too high). Altogether, Fig. B.2 demonstrates that the growth of the MBH decreases as racc gets reduced in size (combined with an increase in the gas resolution at the vicinity of the MBH), and is less susceptible to stochastic processes. The growth of the MBH seems to converge when racc is close to a few parsecs in size, and only shows a slight divergence from our adopted Bondi accretion scheme. This agrees well with Negri & Volonteri (2017), who find that Bondi accretion converges with a flux accretion scheme when racc is comparable to rBondi.
For the remaining set of simulations in Fig. B.1, Mres is gradually reduced from 500 to 10 M⊙ (while racc = 1 pc). Besides the overall higher number of gas cells, the spatial resolution increases on a global scale as Mres decreases. This however does not guarantee a higher spatial resolution at the vicinity of the MBH, meaning that the refinement strategy adopted in Sect. 2.4.2 is still needed to ensure that the MBH at any given time can skim mass of nearby gas cells. The amount of mass accreted over time by the MBH for different values of Mres are shown in Fig. B.3. The numerical set-up seem to convergence as Mres gets close to a few tens of solar masses in size (with Mres = 50 M⊙ being a possible outlier due to stochastic processes).
All Tables
All Figures
|
Fig. 1. Sketch of how the MBH gas accretion model described in Sect. 2.4 behaves on a (sub-)grid level (including some typical length scales adopted for this work). Left: On a grid level, gas cells inside the refinement radius, rref, and the accretion radius, racc, are geometrically refined to ensure that the accretion region, r < racc, of the MBH is always resolved by at least a few tens of gas cells (see Sect. 2.4.2 for more details). Whenever at least one active gas cell inside the accretion region fulfils the accretion criteria, the code first estimates the infalling gas accretion rate according to Eq. (4), and then skim mass of individual gas cells following Eq. (5). Right: If the infalling gas accretion rate Ṁin > 0.02 ṀEdd (or if ṀBH is already sufficiently high from the previous timestep), the skimmed gas is set to evolve on a sub-grid level. There, it is initially placed into a reservoir from which it is allowed to fall on a free-fall timescale down to the so-called circularisation radius, rcirc (the radius at which an accretion disc is expected to form). Finally, the gas is accreted onto the MBH on a viscous timescale (see Eq. 7), assuming a geometrically thin, optically thick accretion disc. When Ṁin < 0.02 ṀEdd, the accretion timescale is expected to be very short (compared to the viscous timescale); thus, no time-lag effects are considered. Instead, the skimmed gas is directly accreted onto the MBH (see Sect. 2.4.1 for more details). |
| In the text | |
|
Fig. 2. Visual demonstration of the complete physical framework described in Sect. 2. Panel (a): Face-on projected column density map of the HI surface density in the low-mass dwarf galaxy at t ∼ 500 Myr in the MBH4_full simulation (see Table 2). Panel (b): Zoom-in on a recently active star-forming region where SNII explosions have injected energy into the surrounding gas, pushing it in all directions shaping a ‘bubble’ in the ISM. Star particles formed during the simulation are indicated and colour-coded according to their stellar age (normalised between 0 and 100 Myr, where blue represents the youngest and red the oldest stellar populations, respectively). Panels (c)–(d): Further zoom-in on a group of young star particles from panel b. By displaying face-on projected column density maps of the HII and H2 surface densities, side-by-side, we can distinguish the molecular cloud from which the star particles were born from (panel d), and how the ISR (modelled using radiative transfer on the fly) from individually sampled O and B stars propagates and ionises the surrounding gas (panel c). Panel (e): Zoom-in on the region close to the central MBH. Panel (f): Further zoom-in on the MBH and its accretion radius racc (dashed black circle), with a slice (aligned in the z direction with the MBH) through the gas displaying its Voronoi structure. At this scale, individual gas cells can be seen inside the accretion region (r < racc), highlighting the refinement strategy outlined in Sect. 2.4.2. |
| In the text | |
|
Fig. 3. Top: Amount of mass accreted over time by the MBH in our Stellar Feedback simulations (see Table 2). Dashed lines indicate the percentage growth of an initial 104 M⊙ MBH. Bottom: Corresponding time evolution of the MBH gas accretion rate (in terms of the Eddington fraction fEdd = ṀBH/ṀEdd). Transparent background lines correspond to the obtained gas accretion rate of individual snapshots, while opaque lines mark the running mean value over 20 Myr. |
| In the text | |
|
Fig. 4. Collection of projected column density maps for the total gas (first column), HI (second column), H2 (third column), and HII (fourth column) surface densities, as well as density-weighted gas temperature maps (fifth column), of the low-mass dwarf galaxy at t ∼ 380 Myr in our Stellar Feedback simulations (see Table 2). For every map, both the face-on (top) and edge-on (bottom) projected view of the galaxy are included. |
| In the text | |
|
Fig. 5. Abundance of HI as a function of gas temperature in the ISM of our MBH4_full simulation (at t ∼ 380 Myr), mass-weighted by the total amount of H per bin. The ISM is split into different phases based on its HI, HII or H2 abundance, and gas temperature, following the definitions of Kim et al. (2023b) (summarised in Table 3). The CMM and WIM are categorised by their H2 and HII abundance, respectively. For the CMM, χH2 > 0.25, meaning that χHI < 0.75, while for the WIM, χHII > 0.5, implying that χHI < 0.5. These upper limits are indicated by blue and green upside-down triangles for the CMM and WIM, respectively. |
| In the text | |
|
Fig. 6. Gas temperature as a function of H number density in the ISM of our MBH4_full simulation (at t ∼ 380 Myr), mass-weighted by the total amount of H per bin, and colour-coded according to the ISM phase definitions of Table 3 (temperature ranges are indicated by dashed lines). |
| In the text | |
|
Fig. 7. Slices through the ISM in our Stellar Feedback simulations (see Table 2), with a face-on (top) and edge-on (bottom) view (at z = 0 and y = 0, respectively) of the low-mass dwarf galaxy at t ∼ 380 Myr, colour-coded according to the ISM phase definitions in Table 3. |
| In the text | |
|
Fig. 8. Mass-weighted probability density functions (integrated and averaged over 800 Myr) of the gas density (top row) and gas temperature (bottom row) for different phases of the ISM (limited to gas inside R < 2.5 kpc and |z|< 300 pc of the low-mass dwarf galaxy mid-plane) in our Stellar Feedback simulations (see Table 2). To reduce the complexity of tracking each individual ISM phase of Table 3, some of the most hot and cold phases are paired together into single phases (see Sect. 3.2 for more details). Shaded areas correspond to one standard deviation (±σ). The sharp cuts in the gas temperature distribution functions are linked to how the different ISM phases are defined (see Table 3). |
| In the text | |
|
Fig. 9. Time-integrated (over 800 Myr) average mass- and volume fractions (left and right column, respectively) for different ISM phases in our Stellar Feedback simulations, both on a global scale (R < 2.5 kpc and |z|< 300 pc around the mid-plane of the low-mass dwarf galaxy, top panels) and on a local scale close to the MBH (R < 10 pc, bottom panels). Fractions < 0.1% are not displayed. |
| In the text | |
|
Fig. 10. Top row: Radial surface density profiles (integrated and averaged over 800 Myr) for different ISM phases in our Stellar Feedback simulations (see Table 2). The radius R is with respect to the position of the MBH, and the calculation of surface densities are limited to gas inside |z|< 300 pc of the MBH. Bottom row: Corresponding mass fraction as a function of radius for each ISM phase in the top row. Shaded areas correspond to one standard deviation (±σ). |
| In the text | |
|
Fig. 11. Time-integrated (over 800 Myr) average radial profiles of the gas inflow (top row) and outflow (bottom row) rate for different ISM phases in our Stellar Feedback simulations (see Table 2). The radius R is with respect to the position of the MBH, and the average gas inflow and outflow rate in each radial bin is calculated for a spherical shell around the MBH (see Sect. 3.3 for more details). Shaded areas correspond to one standard deviation (±σ). |
| In the text | |
|
Fig. 12. Panels (a)–(b): Cut-out of the time evolution (between 100 and 400 Myr) for the gas inflow (panel a) and outflow (panel b) rate at the vicinity of the MBH (through a spherical shell at R = [1, 3] pc) for different ISM phases (coloured lines), in our Stellar Feedback simulations (see Table 2). Panel (c): Corresponding time evolution of the MBH gas accretion rate and its Eddington accretion limit (solid and dash-dotted black line, respectively). Panel (d): As a function of time, the total gravitational binding- (solid blue line), thermal- (dashed orange line), and kinetic energy (dotted green line) of all the inflowing and outflowing gas between R = [1, 3] pc. Panel (e): Radial distances (with respect to the position of the MBH) to nearby SNII explosions as a function of time. |
| In the text | |
|
Fig. 13. Cumulative net gas inflow (disregarding any net outflows) over time at the vicinity of the MBH (through a spherical shell at R = [1, 3] pc) for different ISM phases in our Stellar Feedback simulations (see Table 2). For each run, the total cumulative net gas inflow (including all of the different ISM phases) is provided and indicated by a dashed black line. The growth of the MBH (solid black line for reference), in terms of percentage of the total cumulative net gas inflow, is provided and indicated by a dash-dotted black line. |
| In the text | |
|
Fig. 14. Time evolution of the SFR (in bins of 10 Myr, top row), cumulative amount of stars formed (middle row), and cumulative amount of energy injected into the ISM from SNII explosions (bottom row), on a global scale (R < 2.5 kpc, left column) and close to the MBH (R < 200 pc, right column), in our Stellar Feedback simulations (see Table 2). |
| In the text | |
|
Fig. 15. Amount of mass accreted over time by MBHs of different initial masses. For the initial 104 M⊙ MBH, the MBH4_SNII is displayed, while for the initial 103 M⊙ and 105 M⊙ MBHs, the MBH3 and MBH5 simulations in the Black Hole Mass subset (see Table 2) are, respectively, shown. Dashed coloured lines indicate the percentage growth of each MBH (with respect to their initial masses). |
| In the text | |
|
Fig. 16. Fraction of time spent at various Eddington fractions (fEdd = ṀBH/ṀEdd) for MBHs of different initial masses (same simulations as in Fig. 15). As a reference, the limit for the radiatively efficient regime fEdd = 0.02 (see Sect. 2.4.1 for more details) is indicated by a dashed black line. |
| In the text | |
|
Fig. 17. Amount of mass accreted over time for an initial 104 M⊙ MBH (orange lines) with and without uniformly reducing the angular momentum of the gas in the low-mass dwarf galaxy by 20 and 50% (MBH4_L20 and MBH4_L50 in Table 2, respectively). No ISR feedback is considered. The simulation of an initial 104 M⊙ MBH with Lreduce = 0% corresponds to the MBH4_SNII simulation (see Table 2). A pair of simulations of an initial 106 M⊙ MBH (green lines) with and without Lreduce = 20% is also conducted (MBH6_L20 and MBH6 in Table 2, respectively). |
| In the text | |
|
Fig. A.1. Time evolution of rcirc in a set of simulations conducted in a low DM resolution set-up of our low-mass dwarf galaxy (see Table 1). Top: The efficiency factor βff (see Eq. A.1) is introduced and varied between 0.1 and 0.001 for a MBH of MBH = 104 M⊙ and racc = 1 pc. The shaded dark grey area corresponds to the observational scaling relation of Morgan et al. (2010), while the shaded light grey area represents the theoretical range for a 101−3 M⊙ thin disc (Eq. 9 in Koudmani et al. 2024). Middle: For a MBH of MBH = 104 M⊙, racc is varied between 100 and 10 pc, with and without βff = 0.1. Bottom: With racc = 1 pc, the initial mass MBH of the MBH is varied between 103 and 105 M⊙, with and without βff = 0.1. |
| In the text | |
|
Fig. B.3. Amount of mass accreted over time by an initial 104 M⊙ MBH sink particle for different values of the global target mass, Mres, of gas cells. For comparison, dashed black lines mark the percentage growth of the MBH (with respect to its initial mass) |
| In the text | |
|
Fig. B.1. Typical size of gas cells as a function of gas density (at t ∼ 300 Myr) in all of the simulations making up the resolution study. The characteristic length scale of Bondi accretion rBondi = 2GMBH/cs2 for a 104 M⊙ MBH in T = 104 K gas is indicated by a dash-dotted black line. The two horizontal regions emerging as racc decreases corresponds to the geometrical refinement strategy inside rref and racc, respectively, adopted in Sect. 2.4.2. |
| In the text | |
|
Fig. B.2. Amount of mass accreted over time by an initial 104 M⊙ MBH sink particle for different values of racc, with two simulations run when racc is equal to 10 and 1 pc, respectively (to check how volatile the growth of the MBH sink particle is to stochastic processes). A simulation of Bondi accretion is also conducted, where racc = max(1 pc, rBondi). Dashed black lines indicate the percentage growth of the MBH (with respect to its initial mass). |
| In the text | |
Current usage metrics show cumulative count of Article Views (full-text article views including HTML views, PDF and ePub downloads, according to the available data) and Abstracts Views on Vision4Press platform.
Data correspond to usage on the plateform after 2015. The current usage metrics is available 48-96 hours after online publication and is updated daily on week days.
Initial download of the metrics may take a while.