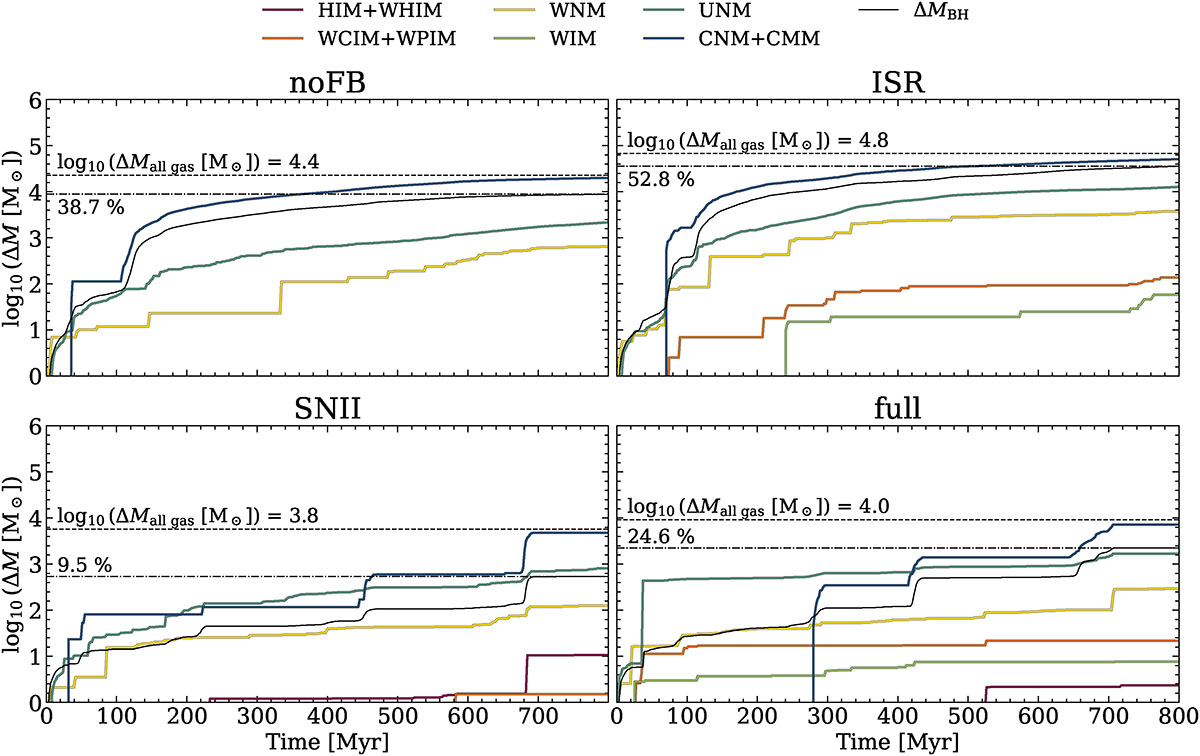
Fig. 13.
Download original image
Cumulative net gas inflow (disregarding any net outflows) over time at the vicinity of the MBH (through a spherical shell at R = [1, 3] pc) for different ISM phases in our Stellar Feedback simulations (see Table 2). For each run, the total cumulative net gas inflow (including all of the different ISM phases) is provided and indicated by a dashed black line. The growth of the MBH (solid black line for reference), in terms of percentage of the total cumulative net gas inflow, is provided and indicated by a dash-dotted black line.
Current usage metrics show cumulative count of Article Views (full-text article views including HTML views, PDF and ePub downloads, according to the available data) and Abstracts Views on Vision4Press platform.
Data correspond to usage on the plateform after 2015. The current usage metrics is available 48-96 hours after online publication and is updated daily on week days.
Initial download of the metrics may take a while.