Fig. 2.
Download original image
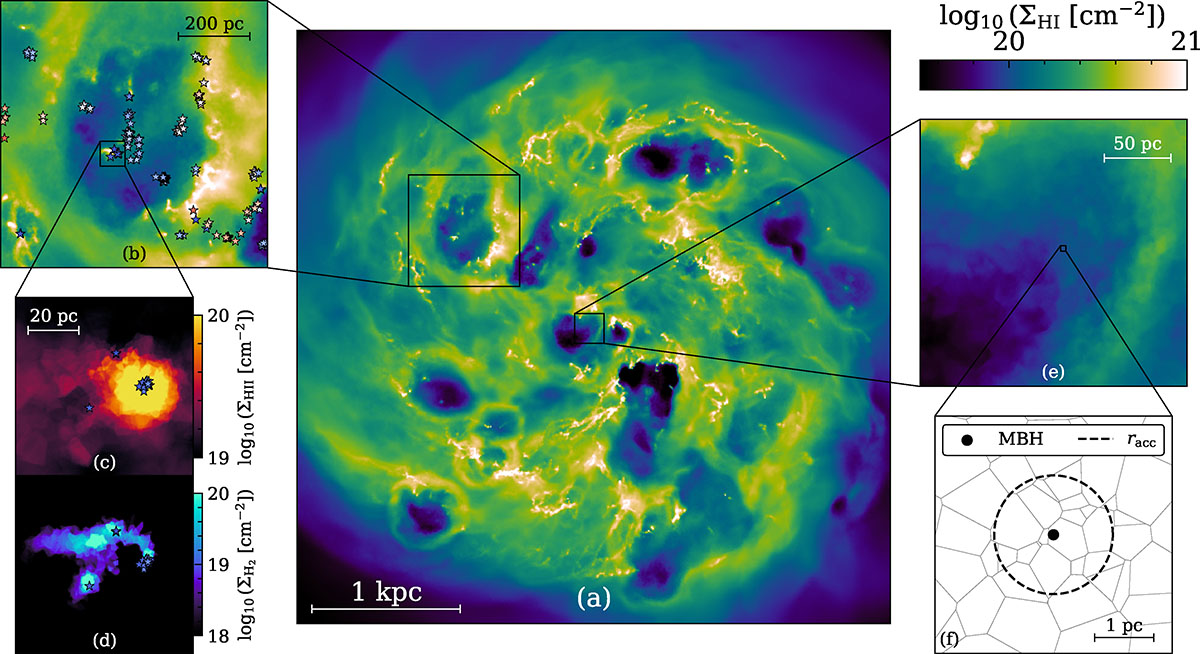
Visual demonstration of the complete physical framework described in Sect. 2. Panel (a): Face-on projected column density map of the HI surface density in the low-mass dwarf galaxy at t ∼ 500 Myr in the MBH4_full simulation (see Table 2). Panel (b): Zoom-in on a recently active star-forming region where SNII explosions have injected energy into the surrounding gas, pushing it in all directions shaping a ‘bubble’ in the ISM. Star particles formed during the simulation are indicated and colour-coded according to their stellar age (normalised between 0 and 100 Myr, where blue represents the youngest and red the oldest stellar populations, respectively). Panels (c)–(d): Further zoom-in on a group of young star particles from panel b. By displaying face-on projected column density maps of the HII and H2 surface densities, side-by-side, we can distinguish the molecular cloud from which the star particles were born from (panel d), and how the ISR (modelled using radiative transfer on the fly) from individually sampled O and B stars propagates and ionises the surrounding gas (panel c). Panel (e): Zoom-in on the region close to the central MBH. Panel (f): Further zoom-in on the MBH and its accretion radius racc (dashed black circle), with a slice (aligned in the z direction with the MBH) through the gas displaying its Voronoi structure. At this scale, individual gas cells can be seen inside the accretion region (r < racc), highlighting the refinement strategy outlined in Sect. 2.4.2.
Current usage metrics show cumulative count of Article Views (full-text article views including HTML views, PDF and ePub downloads, according to the available data) and Abstracts Views on Vision4Press platform.
Data correspond to usage on the plateform after 2015. The current usage metrics is available 48-96 hours after online publication and is updated daily on week days.
Initial download of the metrics may take a while.