Fig. 5.
Download original image
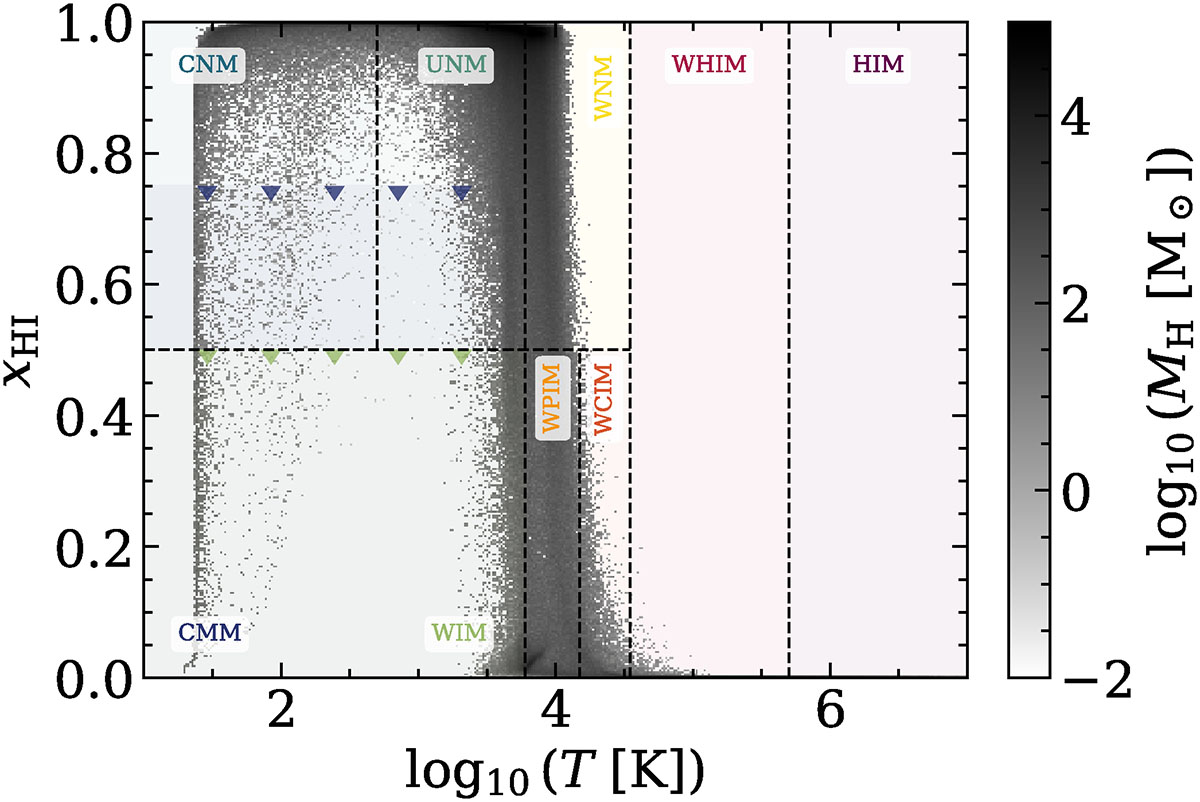
Abundance of HI as a function of gas temperature in the ISM of our MBH4_full simulation (at t ∼ 380 Myr), mass-weighted by the total amount of H per bin. The ISM is split into different phases based on its HI, HII or H2 abundance, and gas temperature, following the definitions of Kim et al. (2023b) (summarised in Table 3). The CMM and WIM are categorised by their H2 and HII abundance, respectively. For the CMM, χH2 > 0.25, meaning that χHI < 0.75, while for the WIM, χHII > 0.5, implying that χHI < 0.5. These upper limits are indicated by blue and green upside-down triangles for the CMM and WIM, respectively.
Current usage metrics show cumulative count of Article Views (full-text article views including HTML views, PDF and ePub downloads, according to the available data) and Abstracts Views on Vision4Press platform.
Data correspond to usage on the plateform after 2015. The current usage metrics is available 48-96 hours after online publication and is updated daily on week days.
Initial download of the metrics may take a while.