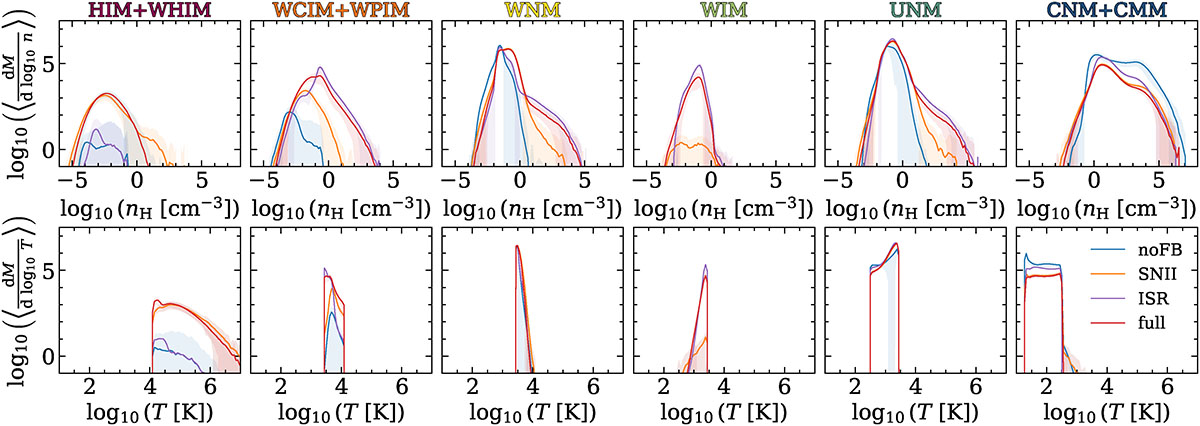
Fig. 8.
Download original image
Mass-weighted probability density functions (integrated and averaged over 800 Myr) of the gas density (top row) and gas temperature (bottom row) for different phases of the ISM (limited to gas inside R < 2.5 kpc and |z|< 300 pc of the low-mass dwarf galaxy mid-plane) in our Stellar Feedback simulations (see Table 2). To reduce the complexity of tracking each individual ISM phase of Table 3, some of the most hot and cold phases are paired together into single phases (see Sect. 3.2 for more details). Shaded areas correspond to one standard deviation (±σ). The sharp cuts in the gas temperature distribution functions are linked to how the different ISM phases are defined (see Table 3).
Current usage metrics show cumulative count of Article Views (full-text article views including HTML views, PDF and ePub downloads, according to the available data) and Abstracts Views on Vision4Press platform.
Data correspond to usage on the plateform after 2015. The current usage metrics is available 48-96 hours after online publication and is updated daily on week days.
Initial download of the metrics may take a while.