Fig. 1.
Download original image
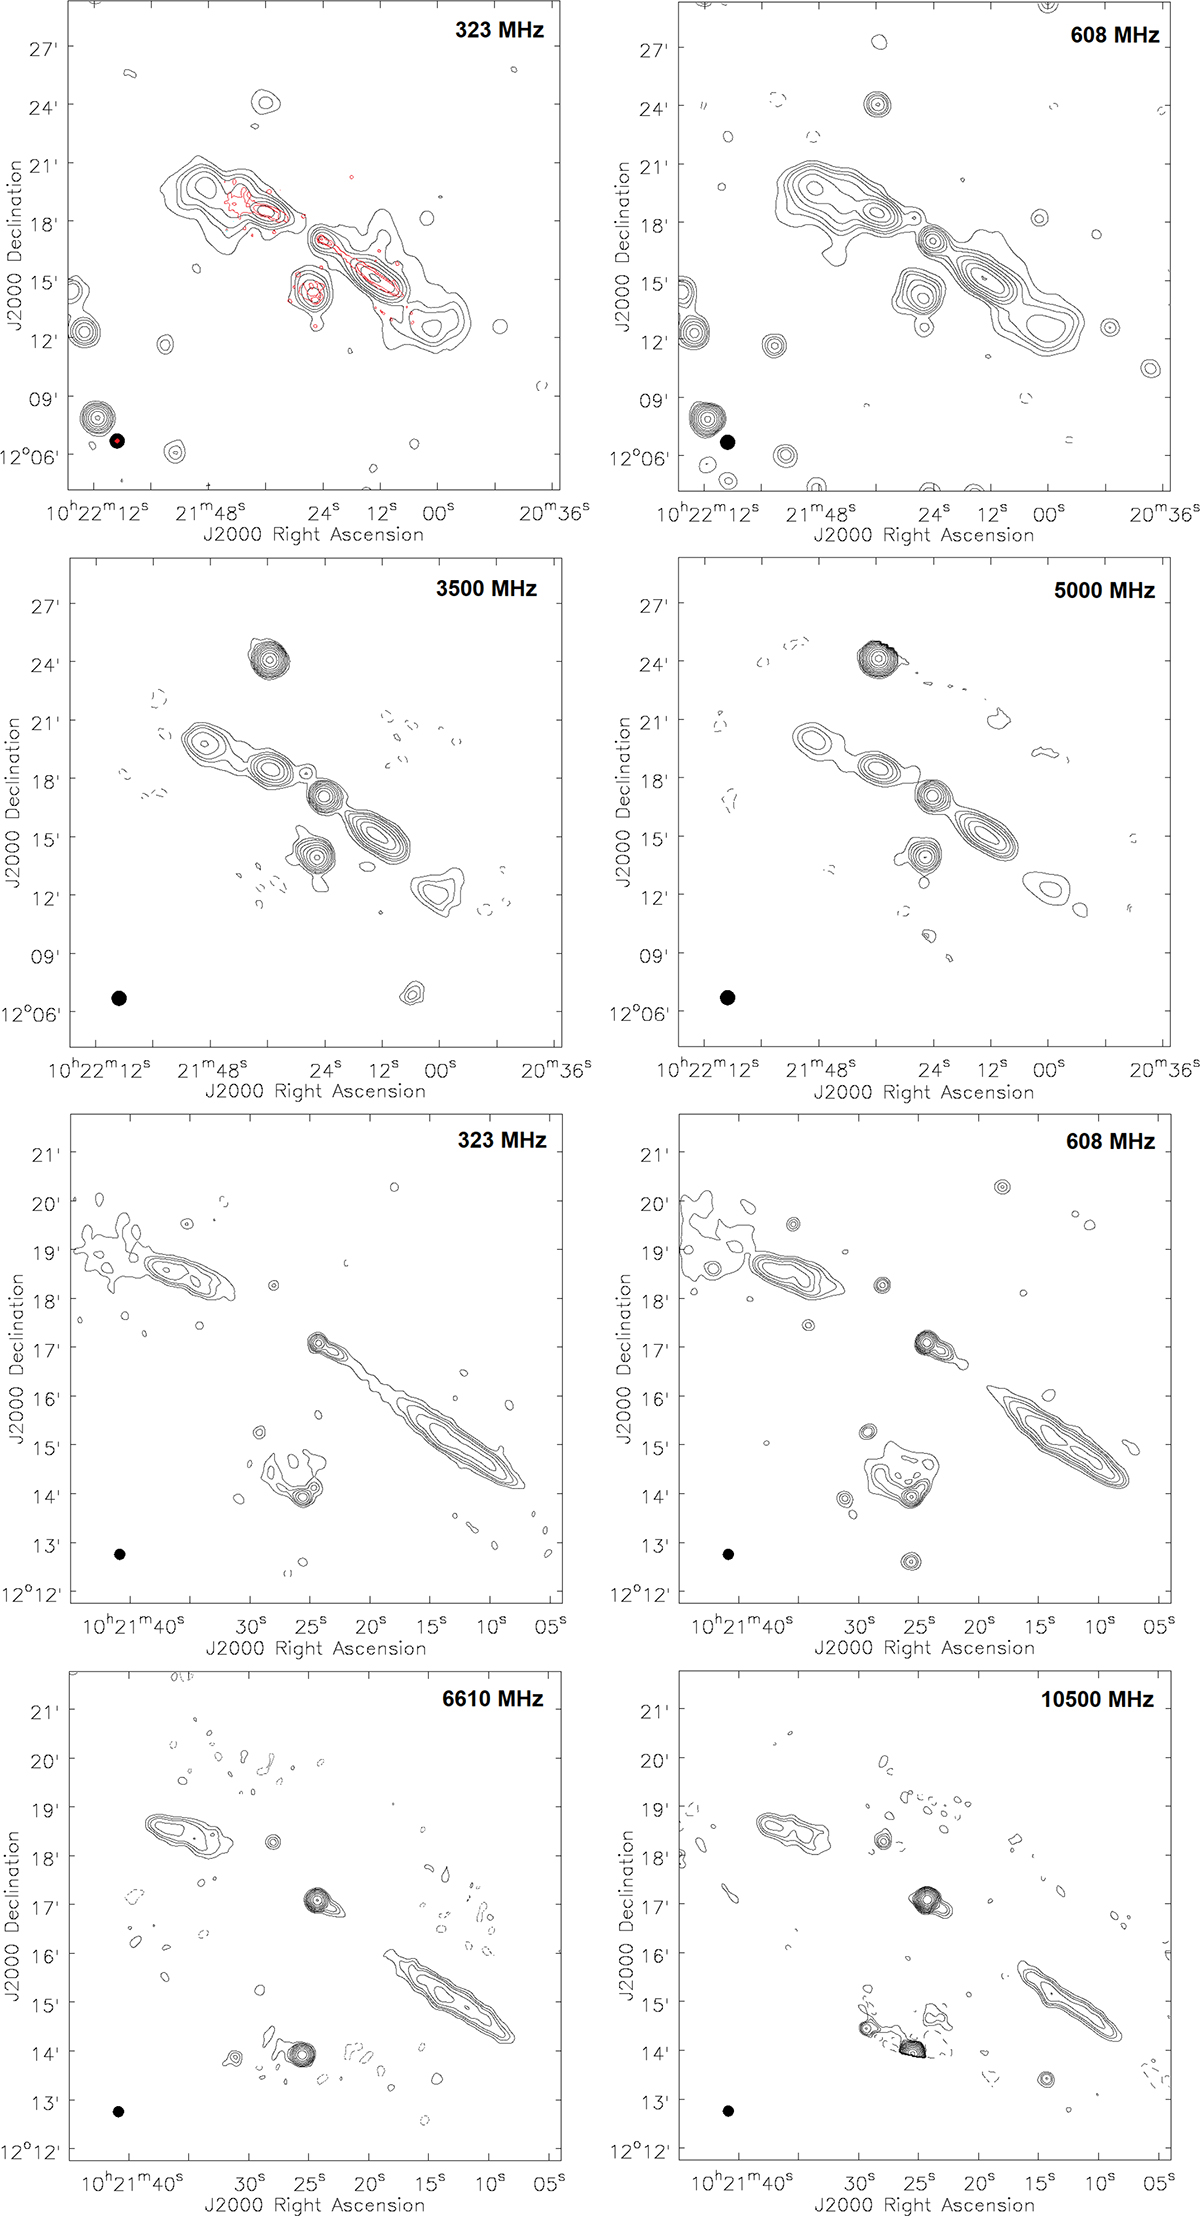
Selected total intensity contour maps of the J1021+1216 outer (top four panels) and inner (bottom four panels) doubles over the entire available frequency range. The contour levels are −3, 3, 6, 9, 15, 24, 39, 63, 102, 165, 267, and 432 × σrms. The negative contours are marked with dashed lines. The basic properties of individual maps together with the noise levels, σrms, are given in Table 1. The center frequencies are shown in the top right corners of each panel. The sizes of the circular beams are 45″ for the outer double maps and 13″ for the inner double maps, and they are shown in the bottom left corners of each panel. The regions with a low signal-to-noise ratio at the edges of the primary beams in the high-frequency maps were masked. In the low-resolution 323 MHz panel, a high-resolution image of the inner structure at the same frequency is overlaid with red contours for reference.
Current usage metrics show cumulative count of Article Views (full-text article views including HTML views, PDF and ePub downloads, according to the available data) and Abstracts Views on Vision4Press platform.
Data correspond to usage on the plateform after 2015. The current usage metrics is available 48-96 hours after online publication and is updated daily on week days.
Initial download of the metrics may take a while.