| Issue |
A&A
Volume 704, December 2025
|
|
|---|---|---|
| Article Number | A284 | |
| Number of page(s) | 15 | |
| Section | Extragalactic astronomy | |
| DOI | https://doi.org/10.1051/0004-6361/202555152 | |
| Published online | 16 December 2025 | |
Multifrequency study of three giant radio galaxies with recurrent jet-formation activity: J1021+1216, J1528+0544, and J2345−0449
I. Radio observations
Astronomical Observatory, Jagiellonian University, Orla 171, PL-30-244 Krakow, Poland
★ Corresponding author This email address is being protected from spambots. You need JavaScript enabled to view it.
Received:
14
April
2025
Accepted:
20
October
2025
Context. The general population of radio galaxies includes several classes of peculiar objects. These include giant radio galaxies (GRGs) with linear sizes greater than 0.7 Mpc and double-double radio galaxies (DDRGs) that show signs of recurrent jet-formation activity. Observations and models developed in recent decades suggest that recurrent activity, among other factors, may stimulate GRG growth. The connection between the two classes of objects is still poorly understood, however, and few of the known giant DDRGs are studied thoroughly so far.
Aims. We studied the giant DDRGs J1021+1216, J1528+0544, and J2345–0449. The collection of radio maps together with the basic parameters of the sources, such as independent measurements of the flux density in the inner and outer lobes, measurements of the linear sizes, and the axial ratio of the lobes will facilitate further in-depth modeling of the objects in the second part of our study.
Methods. We performed multifrequency radio observations of the selected sources with the Karl G. Jansky Very Large Array and the upgraded Giant Metrewave Radio Telescope. The analysis of the radio-lobe morphology and the structure of the spectral index maps provided preliminary information about the environment and activity of the sources.
Results. Outer doubles with asymmetric backflows and minor misalignments were observed in J1021+1216, J1528+0544, and J2345–0449. Low surface brightness wings occur close to the core in J2345–0449. In all three sources, the shorter lobe is the brighter one, which suggests large-scale inhomogeneities in the ambient medium. A trace of emission with low values of the spectral index appears in the outer double maps of J1528+0544. They might indicate the orientation of the jet in the initial activity phase. The asymmetries of the inner lobes in J1021+1216 and J2345–0449 can be explained by a relativistic Doppler effect, while the innder double structure of J1528+0544 requires contamination of the relic radio cocoon.
Conclusions. Our examples of asymmetric backflows and wings in the outer doubles of the sources show inhomogeneities in the external medium around the host galaxies on the size of the radio lobe. This suggests a complex evolution of the radio cocoons. The initial jets appear to clear the ambient medium for the subsequent activity phases. A spectral aging analysis and dynamical modeling are required to confirm the results. We provided this in the second part of this study.
Key words: galaxies: active / galaxies: individual: J1021+1216 / galaxies: individual: J1528+0544 / galaxies: individual: J2345 / 0449 / radio continuum: galaxies
© The Authors 2025
 Open Access article, published by EDP Sciences, under the terms of the Creative Commons Attribution License (https://creativecommons.org/licenses/by/4.0), which permits unrestricted use, distribution, and reproduction in any medium, provided the original work is properly cited.
This article is published in open access under the Subscribe to Open model. This email address is being protected from spambots. You need JavaScript enabled to view it. to support open access publication.
1. Introduction
The linear sizes of giant radio galaxies (GRGs; see, e.g., a review by Dabhade et al. 2023) are unusually large. An arbitrary criterion of at least 0.7 Mpc is usually assumed, and the largest known GRG reaches 7 Mpc (Oei et al. 2024). More than 3000 GRGs are cataloged (Dabhade et al. 2023), and the bulk of them were discovered in recent surveys conducted with the Low Frequency Array (LOFAR, van Haarlem et al. 2013) (Dabhade et al. 2020b; Oei et al. 2023). The estimated comoving number density of GRGs in the local Universe is 5 ± 2 (100 Mpc)−3 (Oei et al. 2023). The main factors that contribute to their extraordinary dimensions probably are (a) the low density of the external medium (Mack et al. 1998), (b) exceptionally powerful radio jets (Gopal et al. 1989), (c) an exceptionally long lifetime (Jamrozy et al. 2008; Komberg & Pashchenko 2009), or (d) recurrent jet-formation activity (Subrahmanyan et al. 1996; Brocksopp et al. 2011).
By comparison, double-double radio galaxies (DDRGs: Schoenmakers et al. 2000) are a rather unique group of objects. Only 74 of them are featured in the catalog of Kuźmicz et al. (2017). A number of new DDRG candidates was discovered since this catalog was compiled (e.g., Mahatma et al. 2019; Kozieł-Wierzbowska et al. 2020; Hardcastle et al. 2023). DDRGs are characterized by multiple pairs of jets (typically two) that are associated with a single host. It is commonly accepted that these features originate from multiple cycles of activity in the active galactic nuclei (AGNs) of the hosts (Schoenmakers et al. 2000). About 13 − 15% of the radio galaxies show signs of restarted activity (Jurlin et al. 2020), and this percentage is even 24% according to some estimates (Saripalli et al. 2012).
Brocksopp et al. (2011) presented a model of radio galaxy growth that was stimulated by recurrent jet-formation activity. An object appears to be a DDRG when the restarted jet propagates fast through the inside of the relic cocoon that was created in an earlier phase (or phases) of activity. After the jet reaches the outer edge of the cocoon, it comes in contact with the ambient medium and proceeds to expand as a regular Fanaroff-Riley-type II (FR II; Fanaroff & Riley 1974) radio galaxy. Walg et al. (2014) presented numerical simulations that illustrated the model well. In addition, based on an example of B0925+420, Brocksopp et al. (2011) argued that due to irregularities in the duration of the duty cycle, a restarted activity phase might be terminated before it reaches the edges of the cocoon, and when yet another phase begins, the source would appear to be a triple-double. Mahatma et al. (2019) showed that DDRGs and regular radio-loud AGNs belong to the same population of astrophysical sources based on similarities in the host properties. Jurlin et al. (2020) reached a similar conclusion by comparing optical and radio properties of active, remnant, and restarted radio galaxies. Komberg & Pashchenko (2009) and Hardcastle et al. (2019) argued that GRGs and regular radio-loud AGNs also belong to the same population. The fraction of giant sources among DDRGs is ∼27% (20 out of 74 in the catalog of Kuźmicz et al. 2017), whereas the fraction of sources with a double-double radio morphology among GRGs is only ∼6% (Dabhade et al. 2020b). This suggests that recurrent activity is not the only mechanism by far that might stimulate radio-galaxy growth. A total of ∼120 giant DDRGs are known (Dabhade et al. 2025, and references therein), but only a few of them were thoroughly studied (e.g.: Konar et al. 2006; Machalski et al. 2010; Brocksopp et al. 2011; Konar et al. 2013; Marecki et al. 2016, 2021).
The precession of jets (possibly caused by the presence of a binary black hole, e.g., Sethi et al. 2024; Misra et al. 2025) or interactions of relativistic plasma with the intergalactic medium in groups and clusters of galaxies (e.g., Mendygral et al. 2012) might lead to a misalignment of the radio lobes within a single activity phase. Dabhade et al. (2025) performed a statistical study on a sample of DDRGs and reported that the misalignment angle in most objects does not exceed ∼20°. The median misalignment angle between the radio lobes is ∼5°, and the standard deviation of the angle distribution is ∼7° in the inner doubles and in the outer doubles with well-defined emission peaks. The authors also noted that large radio sources (> 1.5 Mpc) maintain a more stable direction, with a median misalignment angle ∼3°, than the smaller ones, where the angle is ∼9°. The reorientation of the jet axis between two activity phases might lead to an observed misalignment between the outer and inner lobes. Schoenmakers et al. (2000) defined the DDRG class on a sample of radio galaxies. Based on this, they reported that the misalignment angle between the outer and inner lobes is generally < 10°. By definition, certain X-shaped radio sources (for a brief summary see e.g., Gopal et al. 2012) with a more pronounced misalignment can also count as DDRGs, however. An example of such a DDRG is J1328+2752 (Nandi et al. 2017, 2021), where the misalignment between two epochs of jet emission is ∼30°. This might result from the interaction of a binary black hole.
The goal in the first part of our study is to collect the archival observational data of several selected giant radio sources with recurrent jet-formation activity and supplement it with dedicated observations. Achieving a good coverage of the radio continuum at MHz and GHz frequencies will facilitate a further more detailed study of the selected radio sources by the means of a spectral aging analysis and dynamical modeling in the second part of this research (Paper II Wolnik & Jamrozy 2025). Considering the processes of synchrotron plasma aging and the interaction of the jet and radio cocoon matter with the external medium, we estimate a number of parameters describing the properties of the AGN, the external environment, and the evolution of the radio structure. These parameters include the jet power, the density of the external medium, and the duration of the duty cycle.
We assumed a Λ cold dark matter cosmological model, with the parameters H0 = 67.3 km s−1 Mpc−1, ΩΛ = 0.69, and Ωm = 0.31 (Planck Collaboration VI 2020). Hereafter, we use the spectral index convention Sν ∝ ν−α, meaning that positive values of α indicate a declining power-law spectrum.
2. Observations and data reduction
2.1. Target selection
Based on recently published catalogs of DDRGs and DDRG candidates (Kuźmicz et al. 2017; Kozieł-Wierzbowska et al. 2020) and the Hobby-Eberly Telescope Dark Energy Experiment (HETDEX) Spring field sample (Mahatma et al. 2019), we selected a total of three previously unstudied (in the manner described above) objects based on the following criteria: (1) A total linear size of at least 0.7 Mpc, (2) a total angular size of at least 15′ to allow for a proper separation of inner and outer structures in low-resolution maps, (3) an integrated total power flux density of at least 100 mJy at 1400 MHz to avoid sources with low surface brightness, which are difficult to detect, particularly at high frequencies, and (4) the availability of archival radio observations or, at the very least, survey maps to provide a good coverage of the radio continuum. The three objects we selected are J1021+1216 (10h21m24 3 +12°17′06″), J1528+0544 (15h28m05
 0 +05°44′28″), and J2345–0449 (23h45m32
 7 –04°49′26″).
Both J1021+1216 and J1528+0544 were only recently identified as DDRGs (Kuźmicz et al. 2017). At redshift z = 0.12938 (Ahn et al. 2012), the total linear size of the J1021+1216 outer double is ∼1.85 Mpc, and the size of the inner double is ∼1 Mpc. J1021+1216 is located in a group of galaxies, where its host, bearing signs of recent star formation, is the dominant object (Kuźmicz et al. 2019; Dabhade et al. 2020a). J1021+1216 is one of the largest known sources of this class. Its inner double, which by itself is a giant, is also one of the largest such structures (the largest in Kuźmicz et al. 2017). It shows a rather uniform surface brightness and high average ratio of the lobe length to width (axial ratio) ∼5.5. This suggests that the inner double of J1021+1216 might evolve according to an uncommon bow-shock model (Clarke & Burns 1991) where the restarted jet propagates ballistically through the remnant cocoon.
J1528+0544 is the smallest of the selected objects. At redshift z = 0.0411 (Ahn et al. 2012), the linear size of its outer double is ∼715 kpc. At just ∼18 kpc, the inner double is one of the smallest known restarted radio structures, but its angular size of ∼20″ is reasonable. At an assumed expansion speed of the radio lobes of ∼0.1c (Scheuer 1995), the source might likely have restarted just ∼0.5 Myr ago. It provides a unique opportunity of studying the dynamics of newly formed radio lobes in their early stages of evolution inside a radio cocoon. J1528+0544 was also featured in the catalog of compact double radio sources in the local Universe (Jimenez-Gallardo et al. 2019).
In contrast to the two sources above, J2345–0449 has generated some interest in recent years due to its unique properties. The host of J2345–0449 is one of the most massive known spiral galaxies, with a dynamical mass of ∼1.07 × 10¹² M⊙ (Bagchi et al. 2014). It has no notable neighbors up to a projected radius ∼240 kpc (Bagchi et al. 2014), although it might be a remote member of the RBS 2042 cluster (Bagchi et al. 2014). In the absence of any tidal debris (Bagchi et al. 2014, 2025), the intermittent activity likely arises because the AGN switches between low and high accretion states (Bagchi et al. 2014). The mid-infrared luminosity suggests that the galaxy is forming stars at a rate ∼2.95 M⊙ yr−1 (Dabhade et al. 2020a), which is rather low considering its reservoir of molecular hydrogen, MH2 ≈ 1.6 × 10^{10} M⊙ (Dabhade et al. 2020a). In addition to a generally low star formation rate, there is a lack of recent star formation near the galactic center, which is likely due to AGN feedback (Bagchi et al. 2014; Nesvadba et al. 2021; Bagchi et al. 2025). The central supermassive black hole (SMBH) has a mass of  (Bagchi et al. 2014), and some estimates even reach
  (Walker et al. 2015). The SMBH might be accreting at a sub-Eddington rate (Bagchi et al. 2014). The AGN of J2345–0449 is launching relativistic jets in a direction nearly perpendicular to the galactic disk (Dabhade et al. 2020a), and the jets span ∼1.7 Mpc at a redshift z = 0.0757 (Mauch & Sadler 2007). The inner double of J2345–0449 is ∼400 kpc. Walker et al. (2015) discovered an X-ray halo of hot gas, ∼160 kpc in diameter, elongated along the galactic disk, which might have been disturbed by the expanding jets. Diffuse X-ray emission connected to the radio lobes of J2345–0449 (Walker et al. 2015), which might originate from the inverse-Compton scattering of cosmic microwave background (CMB) photons by the synchrotron particles, was used by Mirakhor et al. (2021) to estimate the strength of the magnetic fields in parts of the outer lobes. In the northern lobe, the magnetic field strength is 0.33 − 0.39 μG, and in the southern lobe, it is 0.22 − 0.23 μG. By selecting J2345–0449 as one of our targets, we wish to verify whether its unusual circumstances are reflected in its properties as compared to the general population of GRGs and DDRGs.
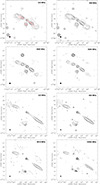 |
Fig. 1. Selected total intensity contour maps of the J1021+1216 outer (top four panels) and inner (bottom four panels) doubles over the entire available frequency range. The contour levels are −3, 3, 6, 9, 15, 24, 39, 63, 102, 165, 267, and 432 × σrms. The negative contours are marked with dashed lines. The basic properties of individual maps together with the noise levels, σrms, are given in Table 1. The center frequencies are shown in the top right corners of each panel. The sizes of the circular beams are 45″ for the outer double maps and 13″ for the inner double maps, and they are shown in the bottom left corners of each panel. The regions with a low signal-to-noise ratio at the edges of the primary beams in the high-frequency maps were masked. In the low-resolution 323 MHz panel, a high-resolution image of the inner structure at the same frequency is overlaid with red contours for reference. |
Basic properties of the radio maps and flux density measurements of individual radio lobes.
2.2. Dedicated observations and survey data
The study is mostly based on new wide-band Karl G. Jansky Very Large Array (VLA) and the upgraded Giant Metrewave Radio Telescope (uGMRT: Gupta et al. 2017) observations with the addition of archival data taken from the National Radio Astronomy Observatory (NRAO) archive1 and GMRT online archive2. The 1400 MHz low-resolution maps of all three sources were taken from the NRAO VLA Sky Survey (NVSS: Condon et al. 1998). The 3000 MHz map of the J1528+0544 inner double was taken from the VLA Sky Survey (VLASS: Lacy et al. 2020) The 888 MHz and 1370 MHz maps of the J2345–0449 inner double were taken from the first data release of the Rapid Australian Square Kilometre Array Pathfinder (ASKAP) Continuum Survey (RACS: McConnell et al. 2020; Hale et al. 2021). A summary of all the archival datasets and dedicated observations is given in Table A.1.
2.3. Data calibration
The precalibration and self-calibration of the wide-band uGMRT and narrow-band GMRT data was performed with the package called source peeling and atmospheric modeling (SPAM: Intema 2014). The prepared datasets were then imaged using common astronomy software applications3 (CASA: Bean 2022).
The VLA observations required preparing a mosaic from several pointings of the instrument because the angular dimensions of the sources exceed the size of the primary beams in most of the configurations we used. The mosaics were prepared for the low-resolution VLA observations of all objects and high-resolution VLA observations of J1021+1216. The wide-band observation data were precalibrated using the VLA calibration pipeline4. The J2345–0449 archival narrow-band data were reduced by hand, using standard procedures5. Then, a few runs of imaging and phase self-calibration were made for every pointing independently until no further improvement was achieved. Because of strong radio-frequency interference (RFI) effects, parts of the wide bands were removed.
2.4. Imaging
All the wide-band datasets were split into several sub-bands that are listed in Table 1 in order to sample the radio continuum better. In order to highlight as much of the diffuse emission as possible in the full-scale images, the datasets were imaged with natural weighting and the visibility tapering. The images were then tapered to 45″ to match the resolution of the NVSS maps. In order to obtain high-resolution inner double maps, the same datasets were imaged with uniform or ROBUST < 0 weighting and were then convolved to common beam sizes. We obtained a resolution of 13″ in the J1021+1216 inner double maps (Fig. 1). The J2345–0449 inner double maps were tapered to 25″ to match the resolution of the RACS map. Because the angular size of the inner double of J1528+0544 is small, dedicated high-resolution observations were made in VLA bands C (4000–8000 MHz) and K (18 000–26 000 MHz) in array configurations B and C, respectively. We achieved resolutions close to 1″ (Fig. 2), but the maps were tapered to 3″ to match the resolution of the VLASS map. Every pointing was imaged and separately corrected for primary beam in CASA. All the pointings for individual sources were then combined using the task FLATN from the astronomical image processing system6 (AIPS) to create the final images we present in Figs. 1, 2, and 3.
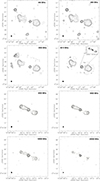 |
Fig. 2. Selected total intensity contour maps of the J1528+0544 outer (top four panels) and inner (bottom four panels) doubles over the entire available frequency range. The contour levels are −3, 3, 6, 9, 15, 24, 39, 63, 102, 165, 267, 432, 699, and 1131 × σrms. The negative contours are marked with dashed lines. The basic properties of individual maps together with noise levels, σrms, are given in Table 1. The center frequencies are shown in the top corners of each panel. The sizes of the circular beams are 45″ for the outer double maps. For the inner double maps, the beam sizes are given in Table 1. The beam sizes are also presented in the bottom left corners of each panel. The regions with a low signal-to-noise ratio at the edges of the primary beams in in high-frequency maps were masked. In the top right corner of the low-resolution 6610 MHz panel, a high-resolution image of the inner structure at the same frequency is included for reference. |
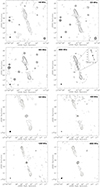 |
Fig. 3. Total intensity contour maps of the J2345–0449 outer (top four panels) and inner (bottom four panels) doubles over the entire available frequency range. The contour levels are –3, 3, 6, 9, 15, 24, 39, 63, 102, 165, 267, and 432 ×σrms. The negative contours are marked with dashed lines. The basic properties of individual maps together with noise levels, σrms, are given in Table 1. The center frequencies are shown in the top corners of each panel. The sizes of the circular beams are 45″ for the outer double maps. For the inner double maps, the beam sizes are given in Table 1. The beam sizes are also presented in the bottom left corners of each panel. The regions with a low signal-to-noise ratio at the edges of the primary beam in the 4860 MHz map were masked. In the top right corner of the low-resolution 4860 MHz panel, a high-resolution image of the inner structure at the same frequency is included for reference. |
2.5. Reliability of the flux measurements
The length of the shortest baselines is finite. Flux might therefore be lost in the large-scale structures of the radio galaxies. The total angular extents of the objects are in the range ∼15′−17′, but the sizes of the individual lobes are smaller. The largest angular scale (LAS) of the uGMRT in band 4 (∼600 MHz) is ∼17′, and it is twice this in band 3 (∼300 MHz). In the D-configuration VLA, the LAS values are ∼8′, ∼4′, and ∼2.′5 in the S, C, and X bands, respectively. In order to estimate the magnitude of the flux loss, the band 3 data were reimaged without the inner baselines to match the characteristics of the arrays at higher frequencies. We found that in low-resolution maps, about 5% and 10% of the flux is lost on average in bands S and C, respectively. Similarly, about 10% of the flux is lost in the-high resolution observations of J1021+1216 in band X. These values are on the order of the assumed 10% of the observational uncertainty. In the most diffuse regions of the outer doubles, however, the flux loss in low-resolution C-band observations may reach 25%. The angular size of the J1528+0544 inner double is smaller than the LAS in the VLA bands and configurations we used.
Emission mixing from the outer and inner lobes is also a problem, particularly for J1021+1216 and J2345–0449 low-frequency observations. When the lobes were not clearly separated, the inner-lobe flux measured on a map reimaged in higher resolution was subtracted from the combined inner- and outer-lobe flux measured on the 45″ map, and the measurement uncertainties were propagated accordingly. For the 148 MHz J2345–0449, this operation was not possible, and the regions in which the two activity phases were superimposed were therefore omitted. The J2345–0449 outer double flux at 148 MHz given in Table 1 might therefore be underestimated by ∼10%. This is within the range of uncertainties.
The sources J1021+1216, J1528+0544, and J2345–0449 are presented in a series of maps in Figs. 1, 2, and 3. The basic properties of these maps along with the flux density measurements of individual structures and the noise levels σrms are given in Tables 1 and 2. The uncertainties of the measured fluxes Sν were calculated as
where Sν is the flux measurement at a given frequency, Ωregion is the solid angle of the measured region, and Ωbeam is the solid angle of the beam.
2.6. Total power radio maps
J1021+1216 (Fig. 1) was observed in the range of frequencies between ∼300 MHz and ∼6610 MHz. VLA X-band data were included in the inner double observations, which extended the range to ∼10 500 MHz. The total linear size of the outer double, measured between the peaks of emission, is ∼1.85 Mpc. For the inner double, the value is ∼1 Mpc. The outer double at low frequencies shows relic emission in the form of asymmetric backflows that stretch north-eeast from the western hot spot and southwest from the eastern hot spot. The backflows gradually faint and disappear with increasing frequency. The outer double is misaligned by ∼12°. At the highest available frequencies (∼6610 MHz), only the regions around the relic hot spots are visible.
The inner lobes of J1021+1216 have a high axial ratio equal to ∼7. The lobes have a uniform surface brightness, without any dominant feature that could be considered a hot spot, and the conical tips are sharp. A ∼60 kpc pronounced emission region extends westward from the core (flux density measurements given in Table 2) and is visible across the entire frequency range. It does not coincide with any background source at the exact position of the core extension in the Panoramic Survey Telescope and Rapid Response System maps (Pan-STARRS: Kaiser et al. 2002, 2010). Hereafter, we assume that the core extension is related to the activity of J1021+1216. There is an indication of a counterstructure at the 3σ level in the 10 500 MHz map.
The source J1528+0544 (Fig. 2) was observed in a range of frequencies between 400 MHz and ∼6610 MHz. A separate set of observations was made to capture its inner double in high resolution, as it is unresolved in the 45″ maps. The total frequency range for the high-resolution maps is between 3000 MHz and 25 500 MHz. The linear size of the outer double barely meets the GRG criterion at ∼715 kpc, while the inner double is only ∼18 kpc. The edge-brightened structure of the outer double is wider than the other two sources in this study. The two lobes are misaligned by ∼10°, which is close to the DDRG population median (Dabhade et al. 2025, the authors describe such sources as having “relatively stable jet direction”).
In the inner double of J1528+0544, hot spots and the core lie along a single axis that might be extended to also reach the hot spot in the eastern outer lobe. The backflow in the western inner lobe appears to be asymmetric. It deviates from the major axis of the source to the south, and fades fast into the noise ∼5 kpc away from the hot spot. By comparison, the backflow in the east extends in a straight line all the way to the core and has a mostly uniform surface brightness with a small local maximum of emission along the way that is visible in 4500 MHz and 18 500 MHz maps. At high frequencies (> 20 000 MHz), the brightness contrast between the hot spots and the still visible fragments of backflow appears to decrease. In addition, there is a small extension to the west of the core that is especially clearly visible at 6500 MHz. It does not correspond to any background source in the Pan-STARRS maps.
The study of J2345–0449 (Fig. 3) was based entirely on archival and survey data. The available frequency range is ∼150 MHz to 4860 MHz for the outer double. The linear size of the outer double is ∼1.7 Mpc, and that of the inner double is ∼400 kpc. The outer double has a high axial ratio ∼8, which is close to what can be observed in the restarted phase of J1021+1216. At ∼300 MHz and ∼600 MHz, low surface brightness wings appear that are placed roughly symmetrically about the main axis of the source. The wings disappear within ∼2 arcmin around the core, so that the central regions are dominated by the emission of the core and the inner double. The outer doubles ale well aligned at an angle ≲2°.
The main features of the inner double in J2345–0449 are the hot spots. The northern spot is brighter (Table 1) and farther away from the core (distance of ∼150″) than the southern spot (distance of ∼120″). This is most likely due to a relativistic Doppler effect. Low brightness emission traces the backflows straight along the main lobe axis. Both lobes show secondary emission peaks in the backflows ∼60″ away from the hot spots, which is visible in the ∼600 MHz and ∼4860 MHz maps. The width of the entire inner structure is about a single beam.
2.7. Spectral index maps
The spectral index α maps (Figs. 4, 5, and 6) were prepared by minimizing the χ2 statistics of a power-law function Sν ∝ ν−α against the full set of radio maps (Table 1). Similarly, the spectral index values given Table 3 were calculated using the integrated flux densities from Tables 1 and 2. A single slice along the inferred jet axis was made through each spectral index map in the inner and outer doubles to create spectral index profiles shown in Fig. 7. The width of the slices is 10″ in the low-resolution maps, 2″ in the high-resolution J1021+1216 map, 1″ in the high-resolution J1528+0544 map, and 4″ in the high-resolution J2345–0449 map.
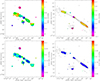 |
Fig. 4. Spectral index maps of the inner and outer double of J1021+1216, presented as color maps. The color bars represent the scales given next to each panel. The gray lines mark the inferred jet axes, along which slices through the images were made to create the spectral index profile shown in Fig. 7. Top left: spectral index map of the whole radio galaxy. A 1400 MHz contour map is overlaid for reference. The contour levels are (3, 9, 39)×0.35 mJy/b.a. The size of the circular beam for the color and contour maps is 45″. Top right: spectral index map of the inner double without the diffuse relic emission. A 323 MHz contour map is overlaid for reference. The contour levels are (3, 9, 39)×0.23 mJy/b.a. The size of the circular beam for the color and contour maps is 13″. Bottom left: spectral index 1σ error map of the whole radio galaxy. The contour map is the same as in the top left panel. Bottom right: spectral index 1σ error map of the inner double. The contour map is the same as in the top right panel. |
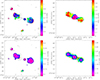 |
Fig. 5. Spectral index maps of the inner and outer double of J1528+0544, presented as color maps. The color bars represent the scales given next to each panel. The gray line marks the inferred jet axes, along which a slice through the image was made to create spectral index profile shown in Fig. 7. Top left: spectral index map of the whole radio galaxy. A 700 MHz contour map is overlaid for reference. The contour levels are (3, 9, 39, 165)×0.33 mJy/b.a. The size of the circular beam for the color and contour maps is 45″. The traces of emission with low spectral index value are marked with a red polygon. Top right: spectral index map of the inner double without the diffuse relic emission. A tapered 4500 MHz contour map is overlaid for reference. The contour levels are (3, 9, 39, 165)×0.03 mJy/b.a. The size of the circular beam for the color and contour maps is 3″. Bottom left: spectral index 1σ error map of the whole radio galaxy. The contour map is the same as in the top left panel. Bottom right: spectral index 1σ error map of the inner double. The contour map is the same as in the top right panel. |
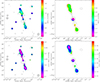 |
Fig. 6. Spectral index maps of the inner and outer double of J2345–0449, presented as color maps. The color bars represent the scales given next to each panel. The gray lines mark the inferred jet axes, along which slices through the images were made to create spectral index profile shown in Fig. 7. Top left: spectral index map of the whole radio galaxy. A 325 MHz contour map is overlaid for reference. The contour levels are (3, 9, 39, 165)×0.7 mJy/b.a. The size of the circular beam for the color and contour maps is 45″. Top right: spectral index map of the inner double without the diffuse relic emission. A tapered 4860 MHz contour map is overlaid for reference. The contour levels are (3,9,39) × 0.1 mJy/b.a. The size of the circular beam for the color and contour maps is 25″. Bottom left: spectral index 1σ error map of the whole radio galaxy. The contour map is the same as in the top left panel. Bottom right: spectral index 1σ error map of the inner double. The contour map is the same as in the top right panel. |
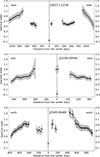 |
Fig. 7. Spectral index profiles of the three radio galaxies made along the slices marked in Figs. 4, 5, and 6, and the complementary error maps. The dots mark the outer double measurements taken from the low-resolution maps, and the squares mark the inner double and core measurements taken from the high-resolution maps. Because the inner double of J1528+0544 is small, the spectral index presented in the middle panel is averaged over the volume of the lobes. |
In the outer double of J1021+1216, the spectral index shows a clear pattern of spectral aging. It is flattest at the relic hot spots, where α ≃ 0.5 − 0.7, and it progressively steepens toward the center to reach α ≃ 1.2 at the point at which the relic emission mixes with the rejuvenated emission from the inner double. In the inner double, the spectral index is approximately constant in the entire volume. It ranges from α ≃ 0.55 to α ≃ 0.65 in the high-resolution maps. It shows no region with a noticeably flatter spectrum that might be identified as a hot spot, nor a typical aging pattern, as is the case in the outer double. The core spectrum is flat, with α ≃ 0, and the spectral index of the small western extension is similar to that of the inner double. The spectral index increases slightly toward the edges of the inner double, most likely due to residual emission form the relic cocoon. The errors of the spectral index estimation do not exceed Δα ≃ 0.2 in the outer double and Δα ≃ 0.15 in the inner double.
In the outer double of J1528+0544, the spectral index of the main body of the outer lobes is α ≃ 0.6, which steepens toward the core to reach α ≃ 0.8 − 0.9 at the noise-level cutoff. A trace of emission appears in both lobes, however, with a noticeably lower spectral index α ≃ 0.4 − 0.5. The northern arm of the trace in the eastern lobe, the southern arm in the western lobe, and the core lie along a single axis that is oriented to within 2° in the same direction as the inner double. The spectrum of the inner lobes is fairly steep with α ≃ 0.9, which is typically associated with aged plasma. The core spectrum is flat with α ≃ 0. The spectral index errors in the outer double are lowest (Δα ≃ 0.1) where the signal-to-noise ratio (S/N) is highest, and they increase toward the edges of the lobes to reach Δα ≃ 0.2. The errors in the inner double do not exceed Δα ≃ 0.25.
The outer double of J2345–0449 shows typical clear signs of spectral aging. The spectrum is flattest around the hot spots with α ≃ 0.5 and progressively steepens toward the core to reach α ≃ 1.3 in the oldest and most diffuse regions. The spectral index in the inner double is α ≃ 0.7 − 0.8 in the main body of the lobes and increases toward the edges through the effect of residual emission from the relic cocoon. The spectral index approaches α ≃ 0.9 around the secondary maximum in the southern inner lobe. The errors in most of the outer double volume do not exceed Δα ≃ 0.2, except for the oldest parts. The errors in the inner double are lowest around the hot spots, where Δα ≃ 0.1.
3. Discussion
3.1. J1021+1216
The asymmetric backflow in the outer double of J1021+1216 is only visible in ∼300 MHz and ∼600 MHz, most likely due to its advanced age. It was only possible to calculate a two-point spectral index in these regions. In the western extension, it is equal to 2.1, and in the eastern extension, it is 1.6. These two values are high, which suggests aged plasma that might have been affected by additional energy-loss mechanisms, such as adiabatic expansion. The inner double shows a high ratio of the lobe length to their width (axial ratio) equal to ∼7, in addition to a weak or absent hot spot. The morphology is similar to that of the inner doubles of B1834+620 (Brocksopp et al. 2011) or PKS B1545–321 (Safouris et al. 2008), where bow-shock models (Clarke & Burns 1991) were considered. In this model, the restarted jets propagate at a high speed through the interior of the relic cocoon to terminate in a weak hot spot and instead drive a bow shock that reaccelerates the relic matter and compresses the magnetic field. The requirement for a high advance speed implies that the age of the inner double is ≲5 Myr at most, which was verified by spectral aging modeling. A modeled age older than ∼5 Myr would imply that the bow-shock model is not realized in J1021+1216 or that the activity in the inner double is quenched. The second option seems probable because the western core extension stretches to ∼60 kpc from the core, which might be the third activity phase. That the counter jet is not visible would be a result of Doppler deboosting, according to the equation describing the k-corrected luminosity ratio of the near (n) and far (f) lobe,
where αinj is the injection index of an aged radio spectrum, β is the advance speed of the hot spots, and θ is the inclination of the jet axis to the line of sight. We assumed the luminosity ratio to be ≳8 (Fig. 1), αinj close to the derived spectral index, and β ≃ 0.5. This parameter combination implies θ ≃ 55°, which is a reasonable value within the limits of radio galaxy inclinations according to the unified scheme (Barthel 1989). In order to produce this luminosity disparity between the two lobes, the expansion speed must be β ≳ 0.28. This is noticeably faster than the typically assumed expansion speed limit 0.1c for most radio galaxies (Scheuer 1995). This is expected of a jet that propagates through the interior of a radio cocoon, however.
3.2. J1528+0544
Structures similar to the trace found in the outer double of J1528+0544 were discovered in the spectral age and χ2 maps of 3C300 and 3C436 (Harwood et al. 2013). The authors explained these structures as jet traces. It is unlikely that a jet still powers the outer double of J1528+0544 because a well-formed ∼18 kpc inner double with a rather steep spectrum α ≃ 0.8 − 0.9 is observed, which suggests aging plasma. The travel time of jet plasma from the core to the hot spots of the outer double of J1528+0544, assuming a bulk velocity close to c, is ∼1 Myr. This is a tight temporal constraint that implies a short quiescent phase and a short restarted activity phase. A spectral aging analysis would help us to verify this hypothesis. Similarly as in J1021+1216, we observe an extension west of the J1528+0544 core, which suggests a third activity phase. Since the extension is poorly resolved, we cannot estimate any of its properties. Very long baseline interferometric observations are required to image it with an appropriate resolution.
3.3. J2345–0449
The low surface brightness wings in J2345–0449, similarly to the backflows in J1021+1216, have a two-point steep spectral index α ≃ 1.9, which contrasts with adjacent regions and implies additional energy-loss mechanisms, such as adiabatic expansion. The structure may have a continuation toward the core and form X-shape-like extensions, for example, in accordance with the backflow diversion model (e.g., Leahy & Williams 1984) or by expansion of the cocoon along the steepest medium pressure gradient (e.g., Capetti et al. 2002) (for a detailed summary see e.g., Gopal et al. 2012). No such continuation is observed at the available frequencies, probably due to plasma aging. In order to confirm the existence of the extensions, we searched for any excess emission, as compared to the GMRT data, in the The GaLactic and Extragalactic All-Sky Murchison Widefield Array (MWA) Survey (GLEAM, Wayth et al. 2015) maps spanning the frequency range between 74 MHz and 231 MHz. No such emission was found in an analysis of the morphology of the radio galaxy or by comparison of the integrated luminosity with the remainder of our dataset. This hypothetical extension might be observed with the low-band antennas of the LOFAR, which can reach frequencies as low as 10 MHz. The generally high axial ratio (∼8, similar to the ratio measured in the inner double of J1021+1216) of the outer double might suggest an alternative model of the J2345–0449 evolution. The outer double might be expanding inside a very old radio cocoon from an earlier activity phase, which would lead to a high advance speed of the hot spots and to a quick growth to a gigantic size. The results of a spectral aging analysis and dynamical modeling would help us to verify this hypothesis.
3.4. Inner and outer double asymmetries
In the outer doubles of all three radio sources, the shorter lobe is also the brighter lobe, which might be explained by inhomogeneities in the ambient medium on the scales of the radio-lobe size. A denser medium tends to increase the efficiency of conversion of the jet power to radio emission (e.g. Gopal & Wiita 1991), but inhibits the growth of the radio lobe (e.g. Machalski et al. 2007). In the inner doubles of J1021+1216 and J2345–0449, the luminosity and arm length ratios provide consistent estimates of the β cos θ factors based on the Equation (2) and the associated lobe length, l, ratio equation,
In the inner double of J1021+1216, β cos θ is close to 0.12, and in the inner double of J2345–0449, β cos θ is in the range 0.07–0.08. The asymmetries in brightness and length of the inner doubles in these two radio sources can be explained satisfactorily by a relativistic Doppler effect. In the inner double of J1528+0544, the β cos θ values estimated using the two ways appear to differ, ∼0 for the length ratio, and 0.04 for the luminosity ratio. This suggests that additional factors might affect the evolution of these lobes. Following the findings of Dabhade et al. (2025), we conclude that the restarted jets of J1021+1216 and J2345–0449 propagate in mostly homogeneous environments of their respective radio cocoon interiors, whereas in J1528+0544, the radio cocoon appears to be contaminated (for example in ways described by Kaiser et al. 2000).
3.5. Preliminary estimation of the spectral ages
It is complex to model the spectral age, and we therefore decided to move the full description and presentation of the results to a separate paper (the second part of the study Wolnik & Jamrozy 2025). We instead used a simpler approximated method here that is based on the analysis of the spectral index variations across the radio lobes.
In the lobes of radio galaxies, the typically assumed processes of the relativistic particle energy, E, losses over time, t, are synchrotron radiation and inverse-Compton scattering of the cosmic microwave background (CMB) photons. When combined, these energy losses take the form  and lead to a temporal evolution of the initially assumed power-law relativistic particle energy spectrum, N(E, t = 0)∝E−(2αinj + 1), where αinj is the spectral index of the initial power-law radio spectrum, Pν ∝ ν−αinj, with the radiation power, Pν, decreasing for an increasing frequency, ν. The particle energy spectrum evolution dictates the evolution of the observed radio spectrum, which develops a break at a certain frequency νbr. For frequencies higher than νbr, the spectrum steepens. Wiita & Gopal (1990) presented an equation (analogous to the one derived by van der Laan & Perola 1969) that showed a dependence between the plasma age, t, at a redshift z, the value of the break frequency, νbr, the values of the magnetic field strength of the lobe, B, and the equivalent magnetic field strength of the CMB, BCMB = 3.18(1 + z)2 μG,

where νbr is given in GHz, t is given in Myr, and η = B/BCMB. For a fixed νbr, the radiative age is maximized if  (e.g. van der Laan & Perola 1969), and we used this value to estimate the upper age limit of the radio lobe.
In order to estimate the break frequency, we compared two extrapolated power-law spectra of an aged region. One spectrum was extrapolated using the injection index, αinj, Pν, inj = P0(ν/ν0)−αinj, and the other was extrapolated using the spectral index, α, measured in a given lobe region Pν, meas = P0(ν/ν0)−α. The point (ν0, P0) is the intersection of the two curves, close to the minimum frequency in a given set of observations. At νbr, the observed flux density of an aged spectrum falls to half of the flux density expected from a linear extrapolation of Pν, inj (see, e.g., Wiita & Gopal 1990). We can write the approximation
solve it for νbr, and substitute it into Equation (4) solved for t, to obtain

Hereafter, we assume  , ν0 equal to the minimum frequency of the observations (listed in Table 1) in GHz, and αinj equal to the lowest measured α at the head of a given radio lobe (αh values listed in Table 4). The process of finding νbr is illustrated in Fig. 8. The errors are computed as
  . In order to estimate tmax of the individual lobes, we took the maximum values of α from their respective spectral index profiles (Fig. 7). Because the spectral index in the inner doubles of all three radio galaxies is rather uniform, we assumed average values of α over their respective volumes.
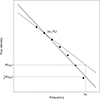 |
Fig. 8. Procedure of finding νbr as described in Sect. 3.5. The units in the logarithmic axes are arbitrary. The black dots show the synthetic flux density measurements generated with BRATS (Harwood et al. 2013, 2015). The dashed line shows the extrapolated power-law spectrum with the αinj exponent. The solid line shows the extrapolated best-fit power-law spectrum to the flux density measurements. The intersection of the two functions is marked as (ν0, P0). νbr is found by solving the Equation (5). |
Results of the preliminary spectral age estimation for the inner and outer doubles of J1021+1216, J1528+0544, and J2345–0449.
The results of the analysis are presented in Table 4 and in Fig. 9. The approximate nature of these estimates is reflected in high uncertainties of tmax. Much more accurate and reliable results can be achieved with a full spectral aging analysis. We compared the derived spectral ages with other studies that compiled a larger number of DDRGs (Nandi et al. 2019; Marecki et al. 2021, and references therein) and GRGs (Jamrozy et al. 2008). The restarted doubles of J1021+1216 and J2345–0449, given their linear sizes, appear to be young when compared to the rest of the population. This is consistent with the model of a fast expansion in the interior of a low-density uniform radio cocoon. The estimated ages of the inner lobes of J1528+0544 are comparable with sources that are two magnitudes larger. This further reinforces the claim that this activity phase of J1528+0544 is quenched.
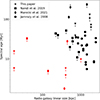 |
Fig. 9. Maximum spectral age estimates for the inner and outer doubles of J1021+1216, J1528+0544, and J2345–0449 (marked as stars) along with the linear sizes of the structures plotted on a logarithmic scale. The age uncertainties were omitted for clarity. The results from this paper are compared with DDRGs compiled in larger studies (Nandi et al. 2019; Marecki et al. 2021) and with a sample of GRGs (Jamrozy et al. 2008). The results for the inner doubles are marked in red. |
The estimated upper age limits for the inner double of J1021+1216 and the outer double of J2345–0449 are higher than anticipated in the context of their expansion speeds, which are ∼0.16c (which is still higher than the typical 0.1c Scheuer 1995) and ∼0.03c, respectively. This might be caused by the choice of the magnetic field strength, which maximizes the perceived age, or by the proportionally long time that passed since the activity was quenched in the respective phases. The values given in Table 4 are the estimated maximum ages of the lobes and not the durations of the active phases, which need to be verified with a full spectral aging analysis. For similar reasons, the ages of the outer doubles of J1021+1216 and J1528+0544 are at the higher end when compared with the results of other studies.
4. Summary and conclusions
We presented radio observations of three giant double-double radio galaxies J1021+1216, J1528+0544, and J2345–0449 in the frequency range ∼300 MHz to ∼6000 MHz. In the inner doubles, we extended the range to ∼25000 MHz for J1528+0544. We list below our findings based on the analysis of the radio-lobe morphology, the structure of the spectral index maps, and the preliminary estimation of the spectral ages based on the analysis of the spectral index variations across the volume of the radio lobe.
Based on the previously unavailable high-resolution high-sensitivity maps of J1021+1216 and J1528+0544, we reported small core extensions that might be related to third activity phases in the two radio galaxies. The claim is supported by the higher than anticipated spectral age estimates for the inner doubles of J1021+1216 and J1528+0544. These are only preliminary results, however, which will be further verified via detailed modeling.
The unusual structure with low values of spectral index in the outer double of J1528+0544 might be a trace of a jet that inflated the radio cocoon. This result needs to be confirmed via spectral aging analysis, however. Constraints on the durations of the active and quiescent phases are required in particular for a proper interpretation of the observed structures.
The high axial ratio of the outer double of J2345–0449 along with the low surface brightness extensions seen at low frequencies suggest two different models for the evolution of the large-scale structure. It might be an X-shape-like evolution in an inhomogeneous ambient medium with a wing formation, fast growth inside a low-density thermal medium, or an old megaparsec-scale radio cocoon. The currently available low-frequency observations do not confirm these structures. The second hypothesis also seems to be contradicted by the high spectral age estimate, unless the activity in that phase were quenched a relatively long time ago. If parameters such as the jet power of the ambient medium density were estimated, we might be able to verify these possibilities.
The asymmetries of lengths and brightness in the outer doubles of all three objects suggest that the radio galaxies are located in inhomogeneous environments. The comparison of the luminosity and linear size ratios showed that the asymmetries in the inner doubles of J1021+1216 and J2345–0449 can be explained by a relativistic Doppler effect, but in the inner double of J1528+0544, the conflicting results of the two methods suggest that the relic cocoon in J1528+0544 was contaminated. The spectral age estimates suggest that the inner doubles of J1021+1216 and J2345–0449 likely evolve (or evolved) in homogeneous cocoons at a fast rate, whereas the activity in the J1528+0544 inner double is already quenched.
Our findings can be verified by a spectral aging analysis and dynamical modeling. We present this in the second part of this study (Wolnik & Jamrozy 2025). The good coverage of the radio spectra is expected to provide us with meaningful results.
Data availability
The full set of FITS maps (Table 1), convolved to common beam sizes, is available at the CDS via https://cdsarc.cds.unistra.fr/viz-bin/cat/J/A+A/704/A284
Acknowledgments
We would like to thank M. Weżgowiec, S. Sethi, and an anonymous referee for their comments and suggestions. This research work was partially supported by the National Science Center (NCN) OPUS-15 grant, no. UMO2018/29/B/ST9/01793. This work has used the Karl G. Jansky Very Large Array operated by the National Radio Astronomy Observatory (NRAO). The NRAO is a facility of the National Science Foundation operated under cooperative agreement by Associated Universities, Inc. We thank the staff of the GMRT that made these observations possible. GMRT is run by the National Center for Radio Astrophysics of the Tata Institute of Fundamental Research.
References
- Ahn, C. P., Alexandroff, R., Allende Prieto, C., et al. 2012, ApJS, 203, 21 [Google Scholar]
- Bagchi, J., Vivek, M., Vikram, V., et al. 2014, ApJ, 788, 174 [NASA ADS] [CrossRef] [Google Scholar]
- Bagchi, J., Ray, S., Dhiwar, S., et al. 2025, MNRAS, 538, 1628 [Google Scholar]
- Barthel, P. D. 1989, ApJ, 336, 606 [Google Scholar]
- Brocksopp, C., Kaiser, C. R., Schoenmakers, A. P., & de Bruyn, A. G. 2011, MNRAS, 410, 484 [CrossRef] [Google Scholar]
- Capetti, A., Zamfir, S., Rossi, P., et al. 2002, A&A, 394, 39 [NASA ADS] [CrossRef] [EDP Sciences] [Google Scholar]
- Bean, B. 2022, PASP, 134, 114501 [NASA ADS] [CrossRef] [Google Scholar]
- Clarke, D. A., & Burns, J. O. 1991, ApJ, 369, 308 [NASA ADS] [CrossRef] [Google Scholar]
- Condon, J. J., Cotton, W. D., Greisen, E. W., et al. 1998, AJ, 115, 1693 [Google Scholar]
- Dabhade, P., Chavan, K., Saikia, D. J., Oei, M. S. S. L., & Röttgering, H. J. A. 2025, A&A, 696, A97 [NASA ADS] [CrossRef] [EDP Sciences] [Google Scholar]
- Dabhade, P., Combes, F., Salomé, P., Bagchi, J., & Mahato, M. 2020a, A&A, 643, A111 [NASA ADS] [CrossRef] [EDP Sciences] [Google Scholar]
- Dabhade, P., Röttgering, H. J. A., Bagchi, J., et al. 2020b, A&A, 635, A5 [NASA ADS] [CrossRef] [EDP Sciences] [Google Scholar]
- Dabhade, P., Saikia, D. J., & Mahato, M. 2023, J. Astrophys. Astron., 44, 13 [NASA ADS] [CrossRef] [Google Scholar]
- Fanaroff, B. L., & Riley, J. M. 1974, MNRAS, 167, 31P [Google Scholar]
- Gopal, K., Biermann, P. L., Gergely, L. Á., & Wiita, P. J. 2012, Res. Astron. Astrophys., 12, 127 [NASA ADS] [CrossRef] [Google Scholar]
- Gopal, K., & Wiita, P. J. 1991, ApJ, 373, 325 [Google Scholar]
- Gopal, K., Wiita, P. J., & Saripalli, L. 1989, MNRAS, 239, 173 [NASA ADS] [CrossRef] [Google Scholar]
- Gupta, Y., Ajithkumar, B., Kale, H. S., et al. 2017, Current Science, 113, 707 [NASA ADS] [CrossRef] [Google Scholar]
- Hale, C. L., McConnell, D., Thomson, A. J. M., et al. 2021, PASA, 38, e058 [NASA ADS] [CrossRef] [Google Scholar]
- Hardcastle, M. J., Williams, W. L., Best, P. N., et al. 2019, A&A, 622, A12 [NASA ADS] [CrossRef] [EDP Sciences] [Google Scholar]
- Hardcastle, M. J., Horton, M. A., Williams, W. L., et al. 2023, A&A, 678, A151 [NASA ADS] [CrossRef] [EDP Sciences] [Google Scholar]
- Harwood, J. J., Hardcastle, M. J., Croston, J. H., & Goodger, J. L. 2013, MNRAS, 435, 3353 [NASA ADS] [CrossRef] [Google Scholar]
- Harwood, J. J., Hardcastle, M. J., & Croston, J. H. 2015, MNRAS, 454, 3403 [NASA ADS] [CrossRef] [Google Scholar]
- Intema, H. T. 2014, Astronomical Society of India Conference Series, 13, 469 [Google Scholar]
- Jamrozy, M., Konar, C., Machalski, J., & Saikia, D. J. 2008, MNRAS, 385, 1286 [NASA ADS] [CrossRef] [Google Scholar]
- Jimenez-Gallardo, A., Massaro, F., Capetti, A., et al. 2019, A&A, 627, A108 [NASA ADS] [CrossRef] [EDP Sciences] [Google Scholar]
- Jurlin, N., Morganti, R., Brienza, M., et al. 2020, A&A, 638, A34 [EDP Sciences] [Google Scholar]
- Kaiser, C. R., Schoenmakers, A. P., & Röttgering, H. J. A. 2000, MNRAS, 315, 381 [Google Scholar]
- Kaiser, N., Aussel, H., Burke, B. E., et al. 2002, in Survey and Other Telescope Technologies and Discoveries, eds. J. A. Tyson, & S. Wolff, SPIE Conf. Ser., 4836, 154 [Google Scholar]
- Kaiser, N., Burgett, W., Chambers, K., et al. 2010, in Ground-based and Airborne Telescopes III, eds. L. M. Stepp, R. Gilmozzi, & H. J. Hall, SPIE Conf. Ser., 7733, 77330E [NASA ADS] [CrossRef] [Google Scholar]
- Komberg, B. V., & Pashchenko, I. N. 2009, Astron. Rep., 53, 1086 [NASA ADS] [CrossRef] [Google Scholar]
- Konar, C., Saikia, D. J., Jamrozy, M., & Machalski, J. 2006, MNRAS, 372, 693 [NASA ADS] [CrossRef] [Google Scholar]
- Konar, C., Hardcastle, M. J., Jamrozy, M., & Croston, J. H. 2013, MNRAS, 430, 2137 [NASA ADS] [CrossRef] [Google Scholar]
- Kozieł-Wierzbowska, D., Goyal, A., & Żywucka, N. 2020, ApJS, 247, 53 [CrossRef] [Google Scholar]
- Kuźmicz, A., Jamrozy, M., Kozieł-Wierzbowska, D., & Weżgowiec, M. 2017, MNRAS, 471, 3806 [CrossRef] [Google Scholar]
- Kuźmicz, A., Czerny, B., & Wildy, C. 2019, A&A, 624, A91 [NASA ADS] [CrossRef] [EDP Sciences] [Google Scholar]
- Leahy, J. P., & Williams, A. G. 1984, MNRAS, 210, 929 [CrossRef] [Google Scholar]
- Lacy, M., Baum, S. A., Chandler, C. J., et al. 2020, PASP, 132, 035001 [Google Scholar]
- Machalski, J., Chyży, K. T., Stawarz, Ł., & Kozieł, D. 2007, A&A, 462, 43 [NASA ADS] [CrossRef] [EDP Sciences] [Google Scholar]
- Machalski, J., Jamrozy, M., & Konar, C. 2010, A&A, 510, A84 [NASA ADS] [CrossRef] [EDP Sciences] [Google Scholar]
- Mack, K. H., Klein, U., O’Dea, C. P., Willis, A. G., & Saripalli, L. 1998, A&A, 329, 431 [NASA ADS] [Google Scholar]
- Mahatma, V. H., Hardcastle, M. J., Williams, W. L., et al. 2019, A&A, 622, A13 [NASA ADS] [CrossRef] [EDP Sciences] [Google Scholar]
- Marecki, A., Jamrozy, M., & Machalski, J. 2016, MNRAS, 463, 338 [CrossRef] [Google Scholar]
- Marecki, A., Jamrozy, M., Machalski, J., & Pajdosz-Śmierciak, U. 2021, MNRAS, 501, 853 [Google Scholar]
- Mauch, T., & Sadler, E. M. 2007, MNRAS, 375, 931 [Google Scholar]
- McConnell, D., Hale, C. L., Lenc, E., et al. 2020, PASA, 37, e048 [Google Scholar]
- Mendygral, P. J., Jones, T. W., & Dolag, K. 2012, ApJ, 750, 166 [NASA ADS] [CrossRef] [Google Scholar]
- Mirakhor, M. S., Walker, S. A., Bagchi, J., et al. 2021, MNRAS, 500, 2503 [Google Scholar]
- Misra, A., Jamrozy, M., Weżgowiec, M., & Kozieł-Wierzbowska, D. 2025, MNRAS, 536, 2025 [Google Scholar]
- Nandi, S., Jamrozy, M., Roy, R., et al. 2017, MNRAS, 467, L56 [NASA ADS] [Google Scholar]
- Nandi, S., Saikia, D. J., Roy, R., et al. 2019, MNRAS, 486, 5158 [CrossRef] [Google Scholar]
- Nandi, S., Caproni, A., Kharb, P., Sebastian, B., & Roy, R. 2021, ApJ, 908, 178 [NASA ADS] [CrossRef] [Google Scholar]
- Nesvadba, N. P. H., Wagner, A. Y., Mukherjee, D., et al. 2021, A&A, 654, A8 [NASA ADS] [CrossRef] [EDP Sciences] [Google Scholar]
- Oei, M. S. S. L., Hardcastle, M. J., Timmerman, R., et al. 2024, Nature, 633, 537 [NASA ADS] [CrossRef] [Google Scholar]
- Oei, M. S. S. L., van Weeren, R. J., Gast, A. R. D. J. G. I. B., et al. 2023, A&A, 672, A163 [NASA ADS] [CrossRef] [EDP Sciences] [Google Scholar]
- Planck Collaboration VI. 2020, A&A, 641, A6 [NASA ADS] [CrossRef] [EDP Sciences] [Google Scholar]
- Safouris, V., Subrahmanyan, R., Bicknell, G. V., & Saripalli, L. 2008, MNRAS, 385, 2117 [NASA ADS] [CrossRef] [Google Scholar]
- Saripalli, L., Subrahmanyan, R., Thorat, K., et al. 2012, ApJS, 199, 27 [Google Scholar]
- Scheuer, P. A. G. 1995, MNRAS, 277, 331 [NASA ADS] [Google Scholar]
- Schoenmakers, A. P., de Bruyn, A. G., Röttgering, H. J. A., van der Laan, H., & Kaiser, C. R. 2000, MNRAS, 315, 371 [Google Scholar]
- Sethi, S., Kuźmicz, A., Jamrozy, M., & Slavcheva-Mihova, L. 2024, ApJ, 969, 156 [NASA ADS] [Google Scholar]
- Subrahmanyan, R., Saripalli, L., & Hunstead, R. W. 1996, MNRAS, 279, 257 [NASA ADS] [CrossRef] [Google Scholar]
- van der Laan, H., & Perola, G. C. 1969, A&A, 3, 468 [NASA ADS] [Google Scholar]
- van Haarlem, M. P., Wise, M. W., Gunst, A. W., et al. 2013, A&A, 556, A2 [NASA ADS] [CrossRef] [EDP Sciences] [Google Scholar]
- Walg, S., Achterberg, A., Markoff, S., Keppens, R., & Porth, O. 2014, MNRAS, 439, 3969 [CrossRef] [Google Scholar]
- Walker, S. A., Bagchi, J., & Fabian, A. C. 2015, MNRAS, 449, 3527 [NASA ADS] [CrossRef] [Google Scholar]
- Wayth, R. B., Lenc, E., Bell, M. E., et al. 2015, PASA, 32 [Google Scholar]
- Wiita, P. J., & Gopal, K. 1990, ApJ, 353, 476 [Google Scholar]
- Wolnik, K., & Jamrozy, M. 2025, A&A, 704, A285 [NASA ADS] [CrossRef] [EDP Sciences] [Google Scholar]
Appendix A: Summary of the properties of the data sets used in this study
Basic information about the observational projects used in this study.
All Tables
Basic properties of the radio maps and flux density measurements of individual radio lobes.
Results of the preliminary spectral age estimation for the inner and outer doubles of J1021+1216, J1528+0544, and J2345–0449.
All Figures
|
Fig. 1. Selected total intensity contour maps of the J1021+1216 outer (top four panels) and inner (bottom four panels) doubles over the entire available frequency range. The contour levels are −3, 3, 6, 9, 15, 24, 39, 63, 102, 165, 267, and 432 × σrms. The negative contours are marked with dashed lines. The basic properties of individual maps together with the noise levels, σrms, are given in Table 1. The center frequencies are shown in the top right corners of each panel. The sizes of the circular beams are 45″ for the outer double maps and 13″ for the inner double maps, and they are shown in the bottom left corners of each panel. The regions with a low signal-to-noise ratio at the edges of the primary beams in the high-frequency maps were masked. In the low-resolution 323 MHz panel, a high-resolution image of the inner structure at the same frequency is overlaid with red contours for reference. |
| In the text | |
|
Fig. 2. Selected total intensity contour maps of the J1528+0544 outer (top four panels) and inner (bottom four panels) doubles over the entire available frequency range. The contour levels are −3, 3, 6, 9, 15, 24, 39, 63, 102, 165, 267, 432, 699, and 1131 × σrms. The negative contours are marked with dashed lines. The basic properties of individual maps together with noise levels, σrms, are given in Table 1. The center frequencies are shown in the top corners of each panel. The sizes of the circular beams are 45″ for the outer double maps. For the inner double maps, the beam sizes are given in Table 1. The beam sizes are also presented in the bottom left corners of each panel. The regions with a low signal-to-noise ratio at the edges of the primary beams in in high-frequency maps were masked. In the top right corner of the low-resolution 6610 MHz panel, a high-resolution image of the inner structure at the same frequency is included for reference. |
| In the text | |
|
Fig. 3. Total intensity contour maps of the J2345–0449 outer (top four panels) and inner (bottom four panels) doubles over the entire available frequency range. The contour levels are –3, 3, 6, 9, 15, 24, 39, 63, 102, 165, 267, and 432 ×σrms. The negative contours are marked with dashed lines. The basic properties of individual maps together with noise levels, σrms, are given in Table 1. The center frequencies are shown in the top corners of each panel. The sizes of the circular beams are 45″ for the outer double maps. For the inner double maps, the beam sizes are given in Table 1. The beam sizes are also presented in the bottom left corners of each panel. The regions with a low signal-to-noise ratio at the edges of the primary beam in the 4860 MHz map were masked. In the top right corner of the low-resolution 4860 MHz panel, a high-resolution image of the inner structure at the same frequency is included for reference. |
| In the text | |
|
Fig. 4. Spectral index maps of the inner and outer double of J1021+1216, presented as color maps. The color bars represent the scales given next to each panel. The gray lines mark the inferred jet axes, along which slices through the images were made to create the spectral index profile shown in Fig. 7. Top left: spectral index map of the whole radio galaxy. A 1400 MHz contour map is overlaid for reference. The contour levels are (3, 9, 39)×0.35 mJy/b.a. The size of the circular beam for the color and contour maps is 45″. Top right: spectral index map of the inner double without the diffuse relic emission. A 323 MHz contour map is overlaid for reference. The contour levels are (3, 9, 39)×0.23 mJy/b.a. The size of the circular beam for the color and contour maps is 13″. Bottom left: spectral index 1σ error map of the whole radio galaxy. The contour map is the same as in the top left panel. Bottom right: spectral index 1σ error map of the inner double. The contour map is the same as in the top right panel. |
| In the text | |
|
Fig. 5. Spectral index maps of the inner and outer double of J1528+0544, presented as color maps. The color bars represent the scales given next to each panel. The gray line marks the inferred jet axes, along which a slice through the image was made to create spectral index profile shown in Fig. 7. Top left: spectral index map of the whole radio galaxy. A 700 MHz contour map is overlaid for reference. The contour levels are (3, 9, 39, 165)×0.33 mJy/b.a. The size of the circular beam for the color and contour maps is 45″. The traces of emission with low spectral index value are marked with a red polygon. Top right: spectral index map of the inner double without the diffuse relic emission. A tapered 4500 MHz contour map is overlaid for reference. The contour levels are (3, 9, 39, 165)×0.03 mJy/b.a. The size of the circular beam for the color and contour maps is 3″. Bottom left: spectral index 1σ error map of the whole radio galaxy. The contour map is the same as in the top left panel. Bottom right: spectral index 1σ error map of the inner double. The contour map is the same as in the top right panel. |
| In the text | |
|
Fig. 6. Spectral index maps of the inner and outer double of J2345–0449, presented as color maps. The color bars represent the scales given next to each panel. The gray lines mark the inferred jet axes, along which slices through the images were made to create spectral index profile shown in Fig. 7. Top left: spectral index map of the whole radio galaxy. A 325 MHz contour map is overlaid for reference. The contour levels are (3, 9, 39, 165)×0.7 mJy/b.a. The size of the circular beam for the color and contour maps is 45″. Top right: spectral index map of the inner double without the diffuse relic emission. A tapered 4860 MHz contour map is overlaid for reference. The contour levels are (3,9,39) × 0.1 mJy/b.a. The size of the circular beam for the color and contour maps is 25″. Bottom left: spectral index 1σ error map of the whole radio galaxy. The contour map is the same as in the top left panel. Bottom right: spectral index 1σ error map of the inner double. The contour map is the same as in the top right panel. |
| In the text | |
|
Fig. 7. Spectral index profiles of the three radio galaxies made along the slices marked in Figs. 4, 5, and 6, and the complementary error maps. The dots mark the outer double measurements taken from the low-resolution maps, and the squares mark the inner double and core measurements taken from the high-resolution maps. Because the inner double of J1528+0544 is small, the spectral index presented in the middle panel is averaged over the volume of the lobes. |
| In the text | |
|
Fig. 8. Procedure of finding νbr as described in Sect. 3.5. The units in the logarithmic axes are arbitrary. The black dots show the synthetic flux density measurements generated with BRATS (Harwood et al. 2013, 2015). The dashed line shows the extrapolated power-law spectrum with the αinj exponent. The solid line shows the extrapolated best-fit power-law spectrum to the flux density measurements. The intersection of the two functions is marked as (ν0, P0). νbr is found by solving the Equation (5). |
| In the text | |
|
Fig. 9. Maximum spectral age estimates for the inner and outer doubles of J1021+1216, J1528+0544, and J2345–0449 (marked as stars) along with the linear sizes of the structures plotted on a logarithmic scale. The age uncertainties were omitted for clarity. The results from this paper are compared with DDRGs compiled in larger studies (Nandi et al. 2019; Marecki et al. 2021) and with a sample of GRGs (Jamrozy et al. 2008). The results for the inner doubles are marked in red. |
| In the text | |
Current usage metrics show cumulative count of Article Views (full-text article views including HTML views, PDF and ePub downloads, according to the available data) and Abstracts Views on Vision4Press platform.
Data correspond to usage on the plateform after 2015. The current usage metrics is available 48-96 hours after online publication and is updated daily on week days.
Initial download of the metrics may take a while.