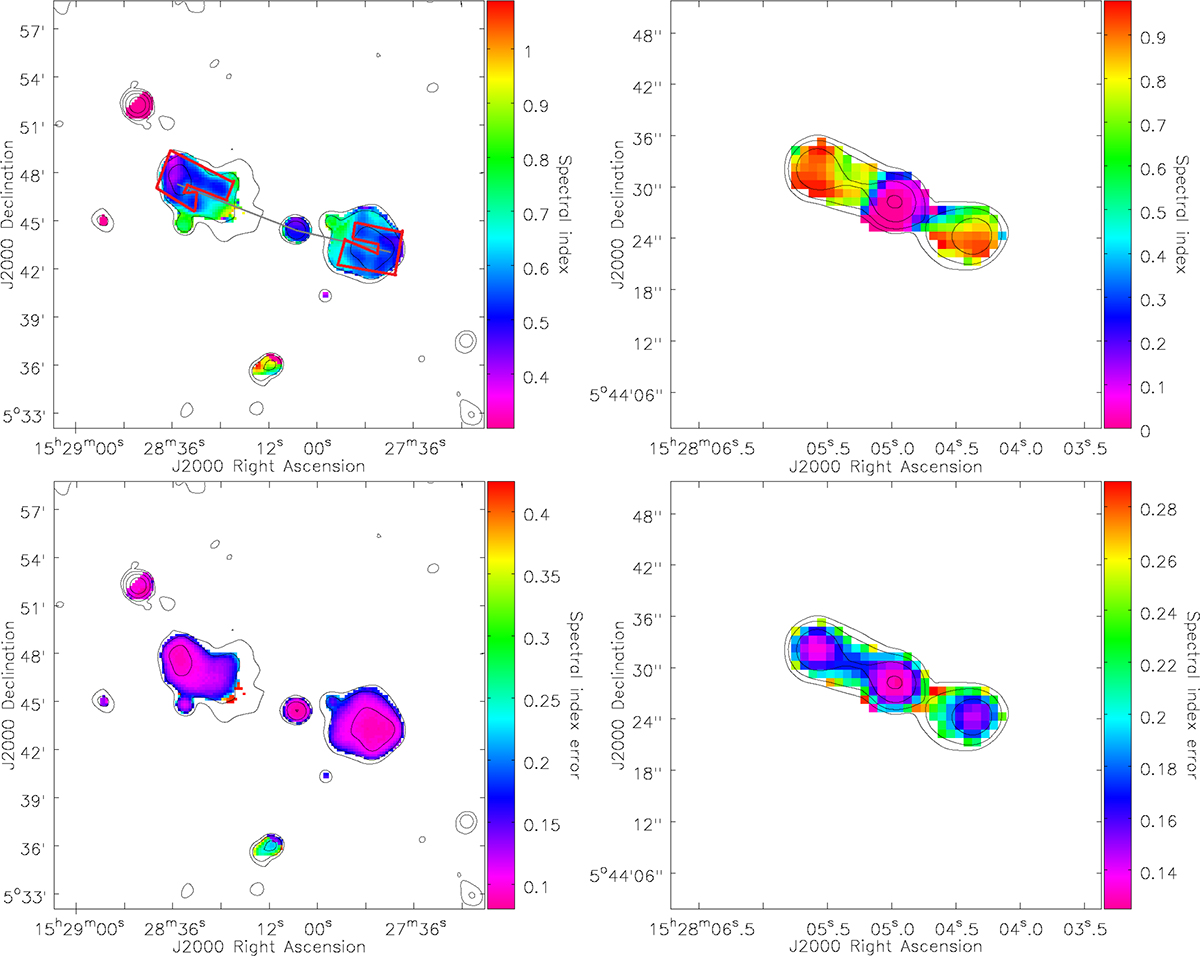
Fig. 5.
Download original image
Spectral index maps of the inner and outer double of J1528+0544, presented as color maps. The color bars represent the scales given next to each panel. The gray line marks the inferred jet axes, along which a slice through the image was made to create spectral index profile shown in Fig. 7. Top left: spectral index map of the whole radio galaxy. A 700 MHz contour map is overlaid for reference. The contour levels are (3, 9, 39, 165)×0.33 mJy/b.a. The size of the circular beam for the color and contour maps is 45″. The traces of emission with low spectral index value are marked with a red polygon. Top right: spectral index map of the inner double without the diffuse relic emission. A tapered 4500 MHz contour map is overlaid for reference. The contour levels are (3, 9, 39, 165)×0.03 mJy/b.a. The size of the circular beam for the color and contour maps is 3″. Bottom left: spectral index 1σ error map of the whole radio galaxy. The contour map is the same as in the top left panel. Bottom right: spectral index 1σ error map of the inner double. The contour map is the same as in the top right panel.
Current usage metrics show cumulative count of Article Views (full-text article views including HTML views, PDF and ePub downloads, according to the available data) and Abstracts Views on Vision4Press platform.
Data correspond to usage on the plateform after 2015. The current usage metrics is available 48-96 hours after online publication and is updated daily on week days.
Initial download of the metrics may take a while.