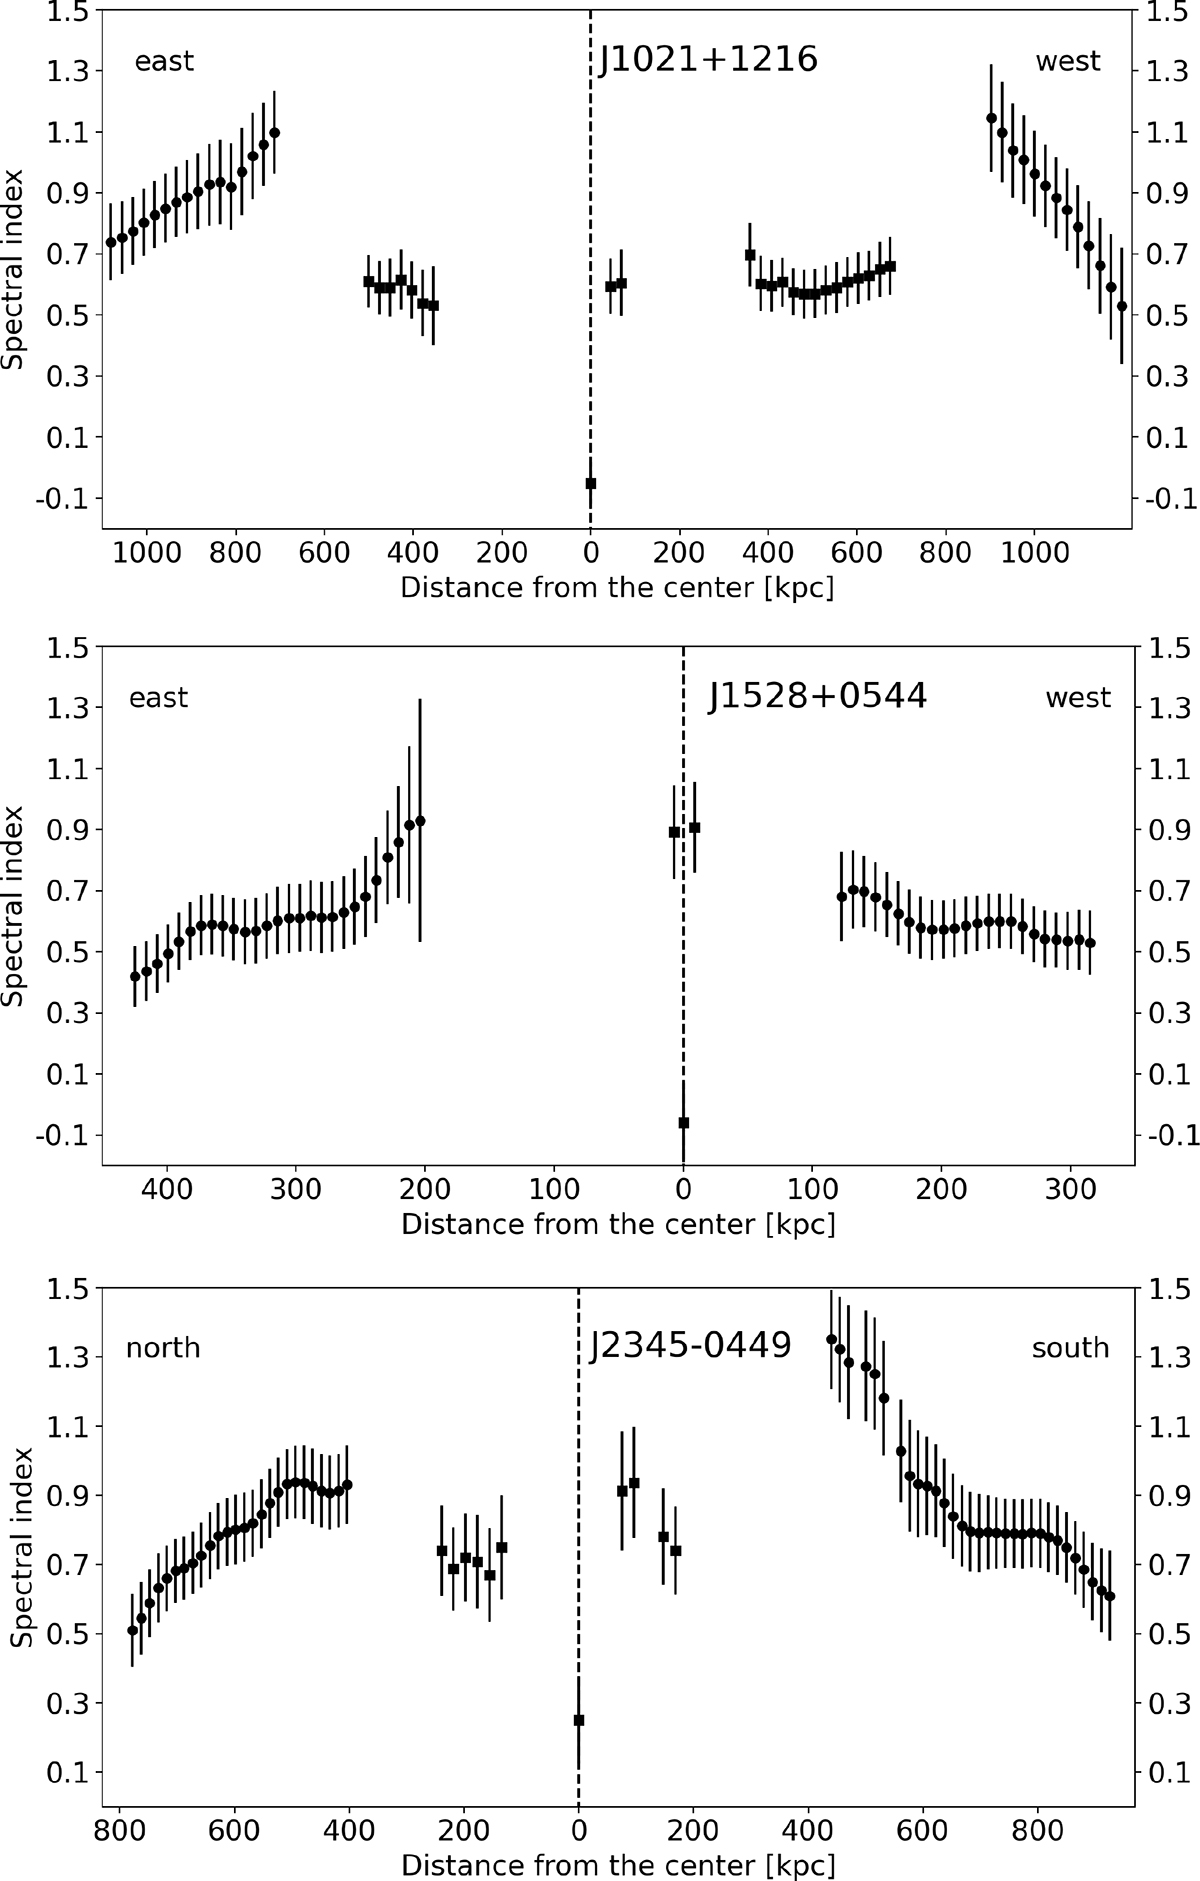
Fig. 7.
Download original image
Spectral index profiles of the three radio galaxies made along the slices marked in Figs. 4, 5, and 6, and the complementary error maps. The dots mark the outer double measurements taken from the low-resolution maps, and the squares mark the inner double and core measurements taken from the high-resolution maps. Because the inner double of J1528+0544 is small, the spectral index presented in the middle panel is averaged over the volume of the lobes.
Current usage metrics show cumulative count of Article Views (full-text article views including HTML views, PDF and ePub downloads, according to the available data) and Abstracts Views on Vision4Press platform.
Data correspond to usage on the plateform after 2015. The current usage metrics is available 48-96 hours after online publication and is updated daily on week days.
Initial download of the metrics may take a while.