Fig. 8.
Download original image
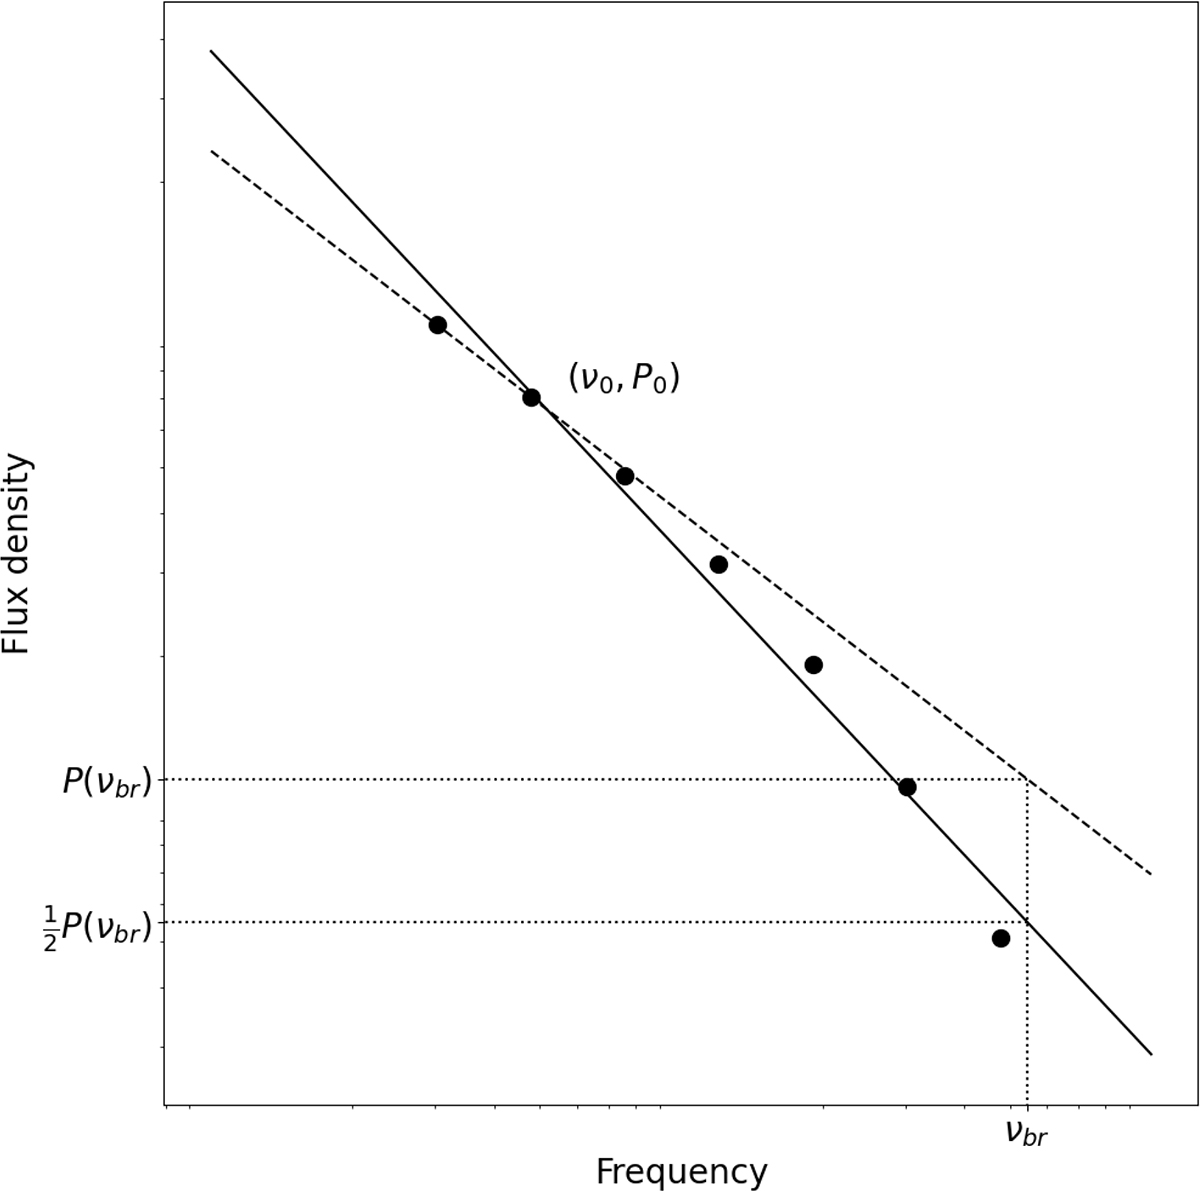
Procedure of finding νbr as described in Sect. 3.5. The units in the logarithmic axes are arbitrary. The black dots show the synthetic flux density measurements generated with BRATS (Harwood et al. 2013, 2015). The dashed line shows the extrapolated power-law spectrum with the αinj exponent. The solid line shows the extrapolated best-fit power-law spectrum to the flux density measurements. The intersection of the two functions is marked as (ν0, P0). νbr is found by solving the Equation (5).
Current usage metrics show cumulative count of Article Views (full-text article views including HTML views, PDF and ePub downloads, according to the available data) and Abstracts Views on Vision4Press platform.
Data correspond to usage on the plateform after 2015. The current usage metrics is available 48-96 hours after online publication and is updated daily on week days.
Initial download of the metrics may take a while.