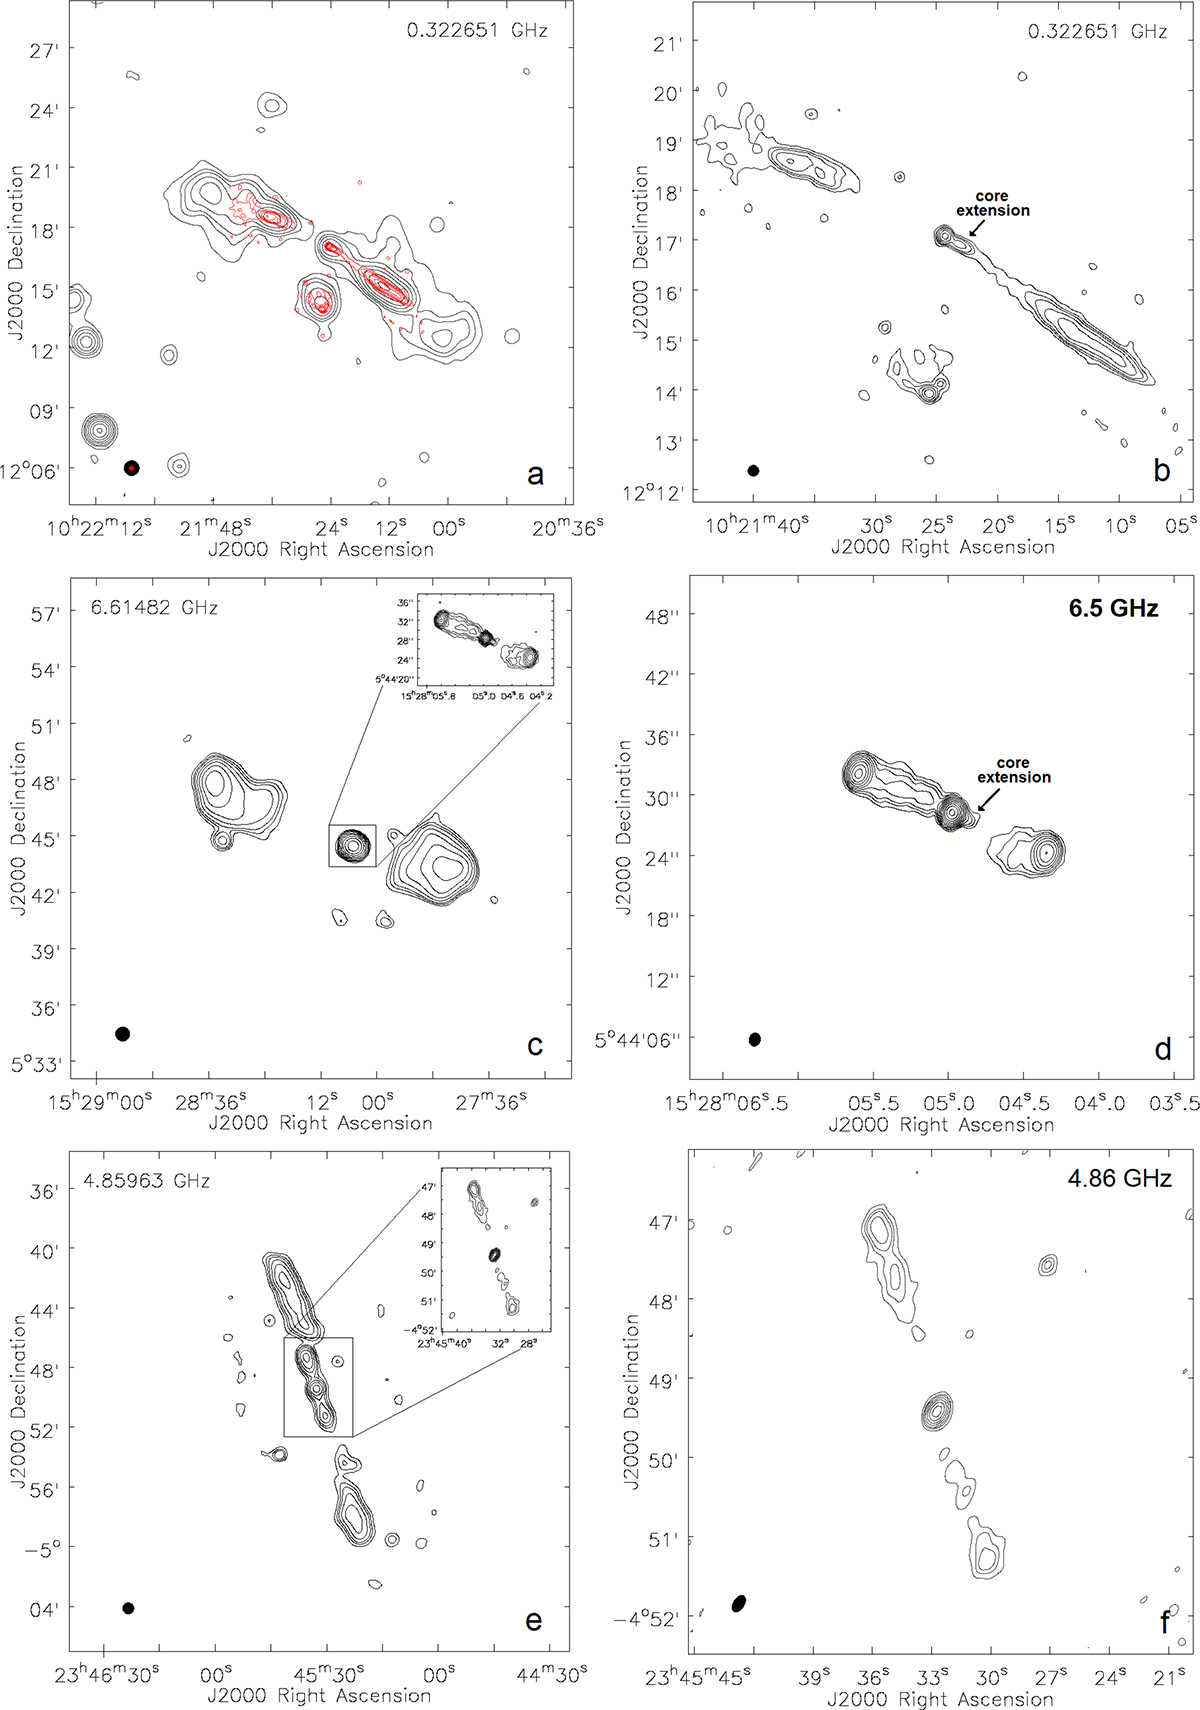
Fig. 1.
Download original image
Selected total intensity contour maps of J1021+1216, J1528+0544, and J2345–0449. The panels are labeled from a to f in the bottom right corners. The beams are shown in the bottom left corners, and the middle frequencies are given at the top of the individual panels. The contour levels are (3, 6, 9, 15, 24, 39, 63, 102, 165, 267, 432) × σrms. Panel a: Low-resolution 45″ map of J1021+1216 (black) at 0.32 GHz with a high resolution 13″ map (red) at the same frequency overlaid for reference. The σrms noise levels are 0.6 mJy/beam in the low resolution map and 0.23 mJy/beam in the high resolution map. Panel b: High-resolution 13″ map of the J1021+1216 inner double at 0.32 GHz. The σrms is 0.23 mJy/beam. Panel c: Low-resolution 45″ map of J1528+0544 at 6.6 GHz. A high-resolution 1″ map of the J1528+0544 central region at the same frequency is shown in the top right corner. The σrms are 0.1 mJy/beam for the low resolution map and 0.015 mJy/beam for the high resolution map. Panel d: High-resolution 1![]() 3 × 1
3 × 1![]() 1 map of the J1528+0544 central region at 6.5 GHz. The σrms is 0.013 mJy/beam. Panel e: Low-resolution 45″ map of J2345–0449 at 4.86 GHz. A high-resolution 14″ × 8″ map of the J2345–0449 central region at the same frequency is shown in the top right corner. The σrms are 0.1 mJy/beam for the low resolution map and 0.05 mJy/beam for the high resolution map. Panel f: High-resolution 14″ × 8″ map of the J2345–0449 central region at 4.86 GHz. The σrms is 0.05 mJy/beam.
1 map of the J1528+0544 central region at 6.5 GHz. The σrms is 0.013 mJy/beam. Panel e: Low-resolution 45″ map of J2345–0449 at 4.86 GHz. A high-resolution 14″ × 8″ map of the J2345–0449 central region at the same frequency is shown in the top right corner. The σrms are 0.1 mJy/beam for the low resolution map and 0.05 mJy/beam for the high resolution map. Panel f: High-resolution 14″ × 8″ map of the J2345–0449 central region at 4.86 GHz. The σrms is 0.05 mJy/beam.
Current usage metrics show cumulative count of Article Views (full-text article views including HTML views, PDF and ePub downloads, according to the available data) and Abstracts Views on Vision4Press platform.
Data correspond to usage on the plateform after 2015. The current usage metrics is available 48-96 hours after online publication and is updated daily on week days.
Initial download of the metrics may take a while.