| Issue |
A&A
Volume 704, December 2025
|
|
|---|---|---|
| Article Number | A285 | |
| Number of page(s) | 14 | |
| Section | Extragalactic astronomy | |
| DOI | https://doi.org/10.1051/0004-6361/202555154 | |
| Published online | 16 December 2025 | |
Multifrequency study of three giant radio galaxies with recurrent jet-formation activity: J1021+1216, J1528+0544, and J2345–0449
II. Spectral aging analysis and dynamical modeling
Astronomical Observatory, Jagiellonian University, Orla 171, PL-30-244 Krakow, Poland
★ Corresponding author This email address is being protected from spambots. You need JavaScript enabled to view it.
Received:
14
April
2025
Accepted:
26
September
2025
Abstract
Context. In the first paper of this series, we presented radio observations of three giant double-double radio galaxies: J1021+1216, J1528+0544, and J2345–0449. We reported the asymmetries and minor misalignments identified in the outer and inner doubles of all three sources, in addition to an uncommon trace of emission with a relatively flat spectrum in the spectral index map of J1528+0544. Furthermore, we discovered core extensions in the J1021+1216 and J1528+0544 high-resolution maps, suggesting that the two sources are triple-double radio galaxies. In this paper, we continue our investigation of the three sources in search of the causes behind these observed peculiarities.
Aims. Our goal is to carry out a detailed study of a selection sample of giant double-double radio galaxies. By determining the properties of these sources and their environments, we obtained a comprehensive image of the processes influencing their evolution, which we could then use to make comparisons with the model results on radio-galaxy evolution from the literature.
Methods. In this work, we used the radio maps prepared and presented in the first paper of this study to perform a spectral aging analysis with the Broadband Radio Astronomy ToolS software and dynamical modeling with the DYNAGE software. From this modeling, we recovered a range of parameters describing the conditions in and around the observed sources, including the duration of the active and quiescent phases, jet power, and external medium density.
Results. Based on our radiative and dynamical models, we report long durations for the active phases in the outer doubles of J1021+1216 and J2345–0449. We report ages of trad, J10 = 43 ± 4 Myr and tdyn, J10 = 250 Myr for J1021+1216, and trad, J23 = 42 ± 4 Myr and tdyn, J23 = 176 Myr for J2345–0449. The inner double of J1021+1216 was found to be expanding at a speed ∼0.5c inside a relic cocoon with a density of log(ρ0 [kg m−3]) = −25.7. In J1528+0544, all the parameters that could influence the evolution of the outer lobes are not out of the ordinary. However, we found a radiatively young structure in the outer lobes, which we interpreted as a trace of a restarted jet belonging to an “intermediate” phase of activity.
Conclusions. We conclude that there is no single universal factor stimulating the growth of the GRGs. In J1021+1216 and J2345–0449 outer doubles, with projected sizes ∼1.85 Mpc and ∼1.7 Mpc, respectively, the main factor stimulating their growth is the exceptionally long duration of their active phases. In J1021+1216 inner double, with a projected size of ∼1 Mpc, the main factor is its fast expansion inside a low-density medium. The outer double J1528+0544, with a projected size ∼715 kpc, represents the case of a giant radio galaxy, where growth was stimulated by the recurrent activity of the galactic nucleus. Furthermore, we report the discovery of two radio galaxies with three separate phases of activity visible at once: J1021+1216 and J1528+0544.
Key words: galaxies: active / galaxies: individual: J1021+1216 / galaxies: individual: J1528+0544 / galaxies: individual: J2345–0449 / radio continuum: galaxies
© The Authors 2025
 Open Access article, published by EDP Sciences, under the terms of the Creative Commons Attribution License (https://creativecommons.org/licenses/by/4.0), which permits unrestricted use, distribution, and reproduction in any medium, provided the original work is properly cited.
This article is published in open access under the Subscribe to Open model. This email address is being protected from spambots. You need JavaScript enabled to view it. to support open access publication.
1. Introduction
The characteristic property of giant radio galaxies (GRGs; for a review, see, e.g., Dabhade et al. 2023) is the linear extent of their radio lobes, being greater than 0.7 Mpc in projection, with the largest known GRG being ∼7 Mpc (Oei et al. 2024). There are about 3000 GRGs cataloged thus far, with most of them discovered in recent years (e.g., Andernach et al. 2021; Simonte et al. 2022; Oei et al. 2023; Dabhade et al. 2023). Advancements in the machine learning field have brought this number up to ∼11 500, with a predicted comoving GRG density 13 ± 10(100 Mpc)−3 (Mostert et al. 2024). A study of LOFAR deep fields (Simonte et al. 2024) demonstrated that it is statistically more likely for GRGs to develop in sparse environments, compared to regular radio galaxies (RGs). In the literature, there are several models available to explain the exceptional growth of certain radio sources. The simplest possibility is a long time scale over which these sources evolve (e.g., Jamrozy et al. 2008; Komberg & Pashchenko 2009). Another explanation is the fast expansion of the radio lobes. The GRGs could achieve this fast expansion either by launching exceptionally powerful jets (e.g., Gopal-Krishna et al. 1989) or by evolving in low-density medium (e.g., Mack et al. 1998). One aspect of particular interest to our study in the context of this paper is a model based on the stimulation of GRG growth by recurrent activity (Subrahmanyan et al. 1996; Brocksopp et al. 2011) of the active galactic nucleus (AGN). According to the model, the jets in the restarted phase of activity initially propagate at a fast rate through the low-density relic cocoon and reach its edges in a relatively short amount of time, after which they push into the external thermal medium, extending the size of the cocoon. As the jets pass through the relic cocoon, they have the capacity to rejuvenate the surrounding matter either by injecting fresh plasma or by reaccelerating the aged particles at the bow-shock created by the jet.
The recurrent activity of the AGN is typically used to explain the peculiar morphology of the double-double radio galaxies (DDRGs: Schoenmakers et al. 2000). In particular, DDRGs are defined as radio galaxies having two edge-brightened pairs of lobes sharing a common core. This definition was constructed to include certain cases of X-shape radio sources (for a review, see, e.g., Gopal-Krishna et al. 2012), although the objects in this study all have well aligned pairs of lobes. The reasons for the intermittent AGN activity are not fully understood at present. Schoenmakers et al. (2000) suggested that the discontinuous supply of material to the galactic center due to merging of the host galaxies could interrupt the process of jet launching. Heckman & Best (2014) proposed a mechanism of self-regulation of the accretion process for RGs located in groups or clusters, which could lead to quenching and reigniting of the jet-formation activity. We know that launched jets transfer part of their kinetic energy to the intergalactic medium, preventing it from flowing into the galactic center, lowering the supply of the material to be accreted, thereby inhibiting the process of jet formation.
There are ∼3000 GRGs known thus far (Dabhade et al. 2023, and references therein). For DDRGs, that number is lower: ∼200 of them have been discovered, mostly in recent years (Kuźmicz et al. 2017; Mahatma et al. 2019; Kozieł-Wierzbowska et al. 2020; Hardcastle et al. 2023). There are about 120 objects belonging to both of these categories (Dabhade et al. 2025, and references therein). Optical, infrared, and radio observations suggest that DDRGs, GRGs, and regular radio-loud AGNs belong to a single parent population of astrophysical objects (Komberg & Pashchenko 2009; Mahatma et al. 2019; Hardcastle et al. 2019; Jurlin et al. 2020). As suggested by Subrahmanyan et al. (1996) and Brocksopp et al. (2011), for some sources belonging to both the GRG and DDRG categories, the relationship between the giant size and recurrent activity could be causal.
The three objects selected for the present study are J1021+1216 (RA: 10h21m24 3 Dec: +12°17′06″), J1528+0544 (RA: 15h28m05
 0 Dec: +05°44′28″), and J2345–0449 (RA: 23h45m32
 7 Dec: –04°49′26″) based on the criteria established in the first paper of our series (Wolnik & Jamrozy 2025, hereafter Paper I): (1) total linear size of at least 0.7 Mpc; (2) total angular size of at least 15′; (3) integrated total power flux density of at least 100 mJy at 1.4 GHz; and (4) availability of archival radio observations. Overall, J1021+1216 and J1528+0544 are poorly known, with no dedicated studies performed and only few survey studies, whereas J2345–0449 was a subject for a number of dedicated studies. The host galaxy of J1021+1216 (redshift z = 0.12938: Ahn et al. 2012) is a dominant object in a group of 16 galaxies (Kuźmicz et al. 2019) and shows signs of recent star formation at a rate 1.44 M⊙/yr (Kuźmicz et al. 2019; Dabhade et al. 2020). The outer double is ∼1.85 Mpc and the inner double is ∼1 Mpc. The mass of the central supermassive black hole (SMBH) is ∼3.6 × 10⁸ M⊙ (Kuźmicz et al. 2017). In J1528+0544 (z = 0.0411: Ahn et al. 2012) the outer double is ∼715 kpc, and the inner double is ∼18 kpc. J1528+0544 was only discovered as a DDRG by Kuźmicz et al. (2017) and described as a compact double by Jimenez-Gallardo et al. (2019). The mass of the J1528+0544 central SMBH is ∼3.7 × 10⁷ M⊙ (Kuźmicz et al. 2017). The host galaxy of J2345–0449 is a massive spiral galaxy (with a dynamical mass of ∼1.07 × 10¹² M⊙ Bagchi et al. 2014) located in a scarce environment, with no notable neighboring galaxies in a ∼240 kpc radius (Bagchi et al. 2014). The central SMBH mass estimates range from ∼2.5 × 10⁸ M⊙ (Bagchi et al. 2014) to ∼5 × 10⁹ M⊙ (Walker et al. 2015). Walker et al. (2015) discovered diffuse X-ray emission coming from the outer lobes of J2345–0449, most likely originating from the inverse Compton scattering of cosmic microwave background (CMB) photons by the synchrotron particles. Comparisons of the inverse Compton emission with radio emission allow for the magnetic field strength to be estimated, with a result of 0.33 − 0.39 μG in the northern lobe and 0.22 − 0.23 μG in the southern lobe (Mirakhor et al. 2021).
The analysis of the radio lobe morphology and of spectral index maps (performed in Paper I) revealed a handful of previously unknown features of the three RGs. Small regions of emission extending to the west from the cores of J1021+1216 and J1528+0544 were found (marked in Fig. 1, hereafter referred to as “core extensions”) to be potentially connected to rejuvenated phases of activity separate from the observed inner doubles. The presence of the core extensions implies that the activity in the ∼1 Mpc inner double of J1021+1216 and in the ∼18 kpc inner double of J1528+0544 is quenched. There are few known RGs with more than two phases of activity visible at once (Brocksopp et al. 2007; Hota et al. 2011; Singh et al. 2016; Biava et al. 2021; Chavan et al. 2023; Brienza et al. 2025). The outer doubles of all three objects evolved in an inhomogeneous environments, judging by the asymmetries of lobe length and brightness, where the shorter lobes are brighter. A similar kind of asymmetry can be seen in the inner double of J1528+0544, which suggests a contamination of the radio cocoon by mixing of the synchrotron plasma with the external medium (possibly in the ways described by Kaiser et al. 2000). In contrast, the inner doubles of J1021+1216 and J2345–0449 are (or were) likely evolving in a mostly homogeneous medium, as the observed asymmetries could be explained by the relativistic Doppler effect. Spectral index maps of J1528+0544 outer double reveal traces of emission with a relatively flat spectrum, as compared to the bulk of the lobe volume. They extend in a straight line from the core to the inferred positions of the hot spots and then expand to fill the entire volume around the hot spots. The structures are similar to the jet traces observed in spectral age maps of 3C 300 and 3C 436 (Harwood et al. 2013); however, a spectral aging analysis would be required to confirm this result. The J2345–0449 outer double exhibits a high ratio of its lobe length to its width (axial ratio), along with low-surface-brightness regions extending laterally close to the core in an X-shape-like fashion. A potential aspect responsible for this morphology is low-density inhomogeneous environment. It allows, on the one hand, for a fast advance speed of the hot spot and, on the other hand, it stimulates the lateral expansion along steep pressure gradients (in the manner described by, e.g., Capetti et al. 2002).
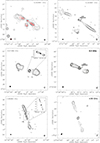 |
Fig. 1. Selected total intensity contour maps of J1021+1216, J1528+0544, and J2345–0449. The panels are labeled from a to f in the bottom right corners. The beams are shown in the bottom left corners, and the middle frequencies are given at the top of the individual panels. The contour levels are (3, 6, 9, 15, 24, 39, 63, 102, 165, 267, 432) × σrms. Panel a: Low-resolution 45″ map of J1021+1216 (black) at 0.32 GHz with a high resolution 13″ map (red) at the same frequency overlaid for reference. The σrms noise levels are 0.6 mJy/beam in the low resolution map and 0.23 mJy/beam in the high resolution map. Panel b: High-resolution 13″ map of the J1021+1216 inner double at 0.32 GHz. The σrms is 0.23 mJy/beam. Panel c: Low-resolution 45″ map of J1528+0544 at 6.6 GHz. A high-resolution 1″ map of the J1528+0544 central region at the same frequency is shown in the top right corner. The σrms are 0.1 mJy/beam for the low resolution map and 0.015 mJy/beam for the high resolution map. Panel d: High-resolution 1 |


This is the second part of our study concerning radio observations and modeling of three giant DDRGs: J1021+1216, J1528+0544, and J2345–0449. The goal of this paper is to determine basic properties of the selected GRGs with recurrent jet-formation activity to see whether the models of GRG growth referenced in this section could be applied to them. This could be achieved by the means of spectral aging analysis and dynamical modeling of radio lobes. Using the Broadband Radio Astronomy ToolS software (BRATS: Harwood et al. 2013, 2015), we attempted a fitting of aged synchrotron plasma models (e.g., Jaffe & Perola 1973) to the radio continuum in different regions of radio lobes to determine their age. Similarly, the KDA model (Kaiser et al. 1997) of radio-lobe dynamical interactions with the surrounding medium could be applied to multifrequency radio data using the DYNAGE software (Machalski et al. 2007) to recover, among other properties, the jet power and the density of the surrounding medium. With these models a comprehensive image of the processes taking place in and around the sources could be obtained.
In this paper we assume a Λ cold dark matter cosmological model, with parameters of H0 = 67.3 km s−1 Mpc−1, ΩΛ = 0.69, and Ωm = 0.31 (Planck Collaboration VI 2020). Hereafter, we use a spectral index convention Sν ∝ ν−α, meaning that positive values of α indicate a declining power-law spectrum. Positions of all the sources are given in the J2000.0 coordinate system.
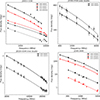 |
Fig. 2. Measurements of flux density integrated from the regions used for the spectral aging analysis (see Figures 3, 4, and 5) along with the best fit continuous injection models plotted on a logarithmic scale. The best fit injection indices αinj are given in Table 1. To separate the plots in the J1021+1216 panel, the data points along with uncertainties and the best fit spectra of the eastern and western inner lobe were multiplied by 0.2 and 0.1, respectively. |
2. Aging analysis
2.1. Preparation of the radio maps
In Paper I, we presented a set of radio observations of the three objects in the frequency ranges ∼102 − 104 MHz along with spectral index maps. The data were collected from dedicated observations made with Karl G. Jansky Very Large Array (VLA) and the upgraded Giant Metrewave Radio Telescope (uGMRT: Gupta et al. 2017). These dedicated observations were supplemented with archival datasets retrieved from the National Radio Astronomy Observatory (NRAO) archive1 and the GMRT online archive2. There is also a number of survey maps included. The pre-calibration and self-calibration of the GMRT data was made with the Source Peeling and Atmospheric Modeling package (SPAM: Intema 2014), the wideband VLA observations were pre-calibrated using the VLA Calibration Pipeline3, and the narrowband VLA data were reduced by hand, using standard procedures4. The prepared data sets were imaged using the Common Astronomy Software Applications5 (CASA: CASA Team 2022). All the resulting maps were aligned in the same reference frame and convolved to common beam sizes of 45″ for all the outer structures, 13″ for the J1021+1216 inner double, 3″ for the J1528+0544 inner double, and 25″ for the J2345–0449 inner double. A summary of all the data sets and radio maps used in this study is given in tables in Paper I.
The maps were clipped at their respective 3σrms noise levels to preserve as much of the weak diffuse emission as possible. The flux density measurement uncertainties are assumed to be 10%. The total angular extents of all three radio galaxies are between 15′ and 18′, although the sizes of individual lobes are typically ≲5′. In case of the J1528+0544, the inner double the angular scale is ≲30″ and, in case of the J2345–0449 inner double, the angular scale is ≲2′. The sizes of individual structures are lower or comparable to the largest angular scales (LAS) of observations in most of the bands and array configurations used. In cases where it was not certain, whether the radio lobes were imaged correctly, we carried out an additional test measuring the magnitude of the possible flux density loss. We attempted an estimation of the magnitude of flux density loss in our radio maps by re-imaging the high LAS observations after removing the inner baselines to match the data set (u,v) plane coverage to the characteristics of the high frequency observations. We found that up to 10% of flux density on average might have been lost in the low resolution C-band maps of all three sources and the high resolution X-band map of J1021+1216 due to insufficient coverage of the (u,v) plane, which is still within the assumed uncertainties, and up to 25% of flux density in C-band may be missing in the most diffuse regions of the outer doubles, which we address in the following sections.
2.2. Estimation of volume and magnetic field strength
For each individual lobe, we assumed a cylindrical shape with dimensions measured between 3σ contours at their maximum extent. The measurements were made on the low-resolution maps for the outer doubles and the high-resolution maps for the inner doubles, at the lowest available frequency. Such a method would lead to an overestimation of the volume, V, due to beam smearing; thus, a volume filling factor, f = 1/2, was introduced in most of the studied regions as a correction. The exceptions were the outer lobes in J1021+1216 and northern outer lobe in J2345–0449, where the filling factor was changed to 1/3, due to their irregular shape. All the volumes are given in Table 1. For the purpose of modeling we assumed a ±50% uncertainty of the volume estimates, mostly due to the unsure value of the filling factors.
To estimate the magnetic field strength B, we use the “classical-1” method derived by Konar et al. (2008, Eq. (A9)), which modifies classical minimum energy approach by integrating the source luminosity over an aged spectrum determined from preliminary spectral age fitting, instead of a pure power-law spectrum. Based on this method, we decided to adapt an equipartition approach to calculating the magnetic field strengths to make the comparison of the results with different papers (e.g., Jamrozy et al. 2007, 2008) easier. We can equate the terms (1 + κ)Ue = UB (Konar et al. 2008, Eq. (A8)) to obtain
![Mathematical equation: $$ \begin{aligned} B_{\rm eq}=\left[ \frac{8\pi A(1+\kappa )}{V\sin ^{3/2}\phi }\right]^{2/7}, \end{aligned} $$](/articles/aa/full_html/2025/12/aa55154-25/aa55154-25-eq6.gif) (1)
(1)
where A is the parameter resulting from the integration of the radio continuum (Konar et al. 2008, Eq. (A7)), κ is the proton to electron energy density ratio, assumed to be 0 for a pure electron-positron plasma, V is the volume of the source, and ϕ is the particle pitch angle, averaged to (2/3)3/4 for an isotropic distribution of particles. Overall the equipartition method yields magnetic field strengths ∼10% higher than the minimum energy approach. The results, along with the errors, are given in Table 1. The errors were calculated by propagating the uncertainties of the volume (ΔV)/V = 0.5 and of the radio luminosity (contained in the parameter A in Konar et al. 2008, Eq. (A7)) ranging from 10% to 15% depending on the input flux density measurements (Paper I). The expression for the magnetic field error, ΔB, is
 (2)
(2)
2.3. Spectral age modeling method
Relativistic particles, accelerated at the hot spots and injected into the radio cocoon, lose their energy by the means of synchrotron radiation and inverse Compton scattering of the cosmic microwave background (CMB) photons. The rate of energy loss,  , is faster for highly energetic particles, which causes an evolution in time of the initially assumed power-law energy spectrum of the synchrotron particles. The evolution also finds a reflection in the shape of the radio spectrum. Initially a power law, it develops a break at a frequency, νbr, dependent on the age of the plasma, assuming a known magnetic field strength, according to the equation
![Mathematical equation: $$ \begin{aligned} \tau _{\rm rad}=1590.6\frac{B^{1/2}}{B^2+B_{\rm CMB}^2}\left[\nu _{\rm br}(1+z)\right]^{-1/2}, \end{aligned} $$](/articles/aa/full_html/2025/12/aa55154-25/aa55154-25-eq9.gif) (3)
(3)
where the radiative age, τrad, is expressed in Myr, the magnetic field, B, in μG, and the break frequency, νbr, in GHz. The equivalent CMB magnetic field strength is BCMB = 3.18(1 + z)2 μG.
The commonly used models of spectral aging are the single injection (Jaffe & Perola 1973, hereafter JP) model, assuming that after an initial momentary injection, the particles only expend their energy, and the continuous injection model (CI; Pacholczyk 1970), assuming that fresh particles are supplied at a constant rate, while the already injected particles keep losing their energy similarly as in the JP model. Both models assume a constant strength of the magnetic field, but there is a visible modification of the JP model, assuming a variable magnetic field (Tribble 1993; Hardcastle 2013, hereafter JP-Tribble), which changes the curvature of the spectrum. By applying these models of spectral aging to the observational data, it is possible to recover the break frequency and translate it to spectral age.
The modeling was conducted according to the following assumptions: (1) only synchrotron and inverse Compton scattering processes are considered; (2) the energy spectrum of the particles injected into the lobes is constant during the activity phase and follows a power law with an index p = 2αinj + 1 in the energy range between the Lorentz γ factors 10 and 106; (3) in each individual region of the source all the plasma has the same age; and (4) the timescale of the particle pitch angle isotropization is much shorter than their lifetime. There are additional considerations regarding the behavior of the magnetic field. In the JP model, the magnetic field is assumed to be constant over the particle lifetime, whereas in the JP-Tribble model, the magnetic field changes according to the Maxwell-Boltzmann distribution.
In this study, we used the BRATS package Harwood et al. (2013, 2015). The program divides the source into regions, based on the signal to noise ratio (S/N) criterion, and models the spectral age in those regions independently. Every single radio lobe in this study was loaded into the program and modeled separately, as it allows for the use of independent estimates of magnetic field strengths and injection spectral indices, αinj. Since a radio lobe can be treated as a single region into which fresh particles are injected at a constant rate, according to the above assumptions, the injection spectral indices were estimated by fitting the CI model to the integrated flux densities from the regions of each individual lobe where the emission was observed across the entire available frequency range (Fig. 2). These are the regions where the detailed modeling shown in Figures 3, 4, and 5 was performed. The αinj estimates are given in Table 1. By deriving the αinj from the integrated flux densities we were aiming to achieve a higher S/N, which would lead to more reliable results overall.
Basic lobe parameters and the results of spectral age modeling.
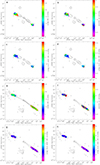 |
Fig. 3. Spectral age maps of J1021+1216 outer and inner double presented as color maps, with color bars representing the scales given next to each panel. Each panel is labeled from a to h in the top-right corner. In panels a–d, a 1.4 GHz contour map is overlaid for reference. The contour levels are (3, 9, 39)×0.35 mJy/beam. The size of the circular beam for the color and contour maps is 45″. In panels e–h a 323 MHz contour map was overlaid for reference. The contour levels are (3, 9, 39)×0.23 mJy/beam. The size of the circular beam for the color and contour maps is 13″. Panel a: Spectral age map of the whole RG. The gray line marks a slice through the source. The age profile, which was created this way, is shown in Fig. 7. Panel b: χred2 map of the whole RG. The regions with χred2 > 3.02 (99% confidence interval) are marked in red. Panel c: Spectral age 1σ upper error map of the whole RG. Panel d: Spectral age 1σ lower error map of the whole RG. Panel e: Spectral age map of the inner double. The gray line marks a slice through the source. The age profile, which was created this way, is shown in Fig. 7. Panel f: χred2 map of the inner double. The regions with χred2 > 3.02 (99% confidence interval) are marked in red. Panel g: Spectral age 1σ upper error map of the inner double. Panel h: Spectral age 1σ lower error map of the inner double. |
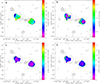 |
Fig. 4. Spectral age maps of J1528+0544 outer double presented as color maps, with color bars representing the scales given next to each panel. Each panel is labeled from a to d in the top-right corner. A 700 MHz contour map is overlaid for reference. The contour levels are (3, 9, 39, 165)×0.33 mJy/beam. The size of the circular beam for the color and contour maps is 45″. Panel a: Spectral age map of the whole RG. The gray line marks a slice through the source. The age profile, which was created this way, is shown in Fig. 7. Panel b: χred2 map of the whole RG. The regions with χred2 > 2.8 (99% confidence interval) are marked in red. Panel c: Spectral age 1σ upper error map of the whole RG. Panel d: Spectral age 1σ lower error map of the whole RG. |
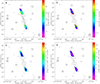 |
Fig. 5. Spectral age maps of J2345–0449 outer double presented as color maps, with color bars representing the scales given next to each panel. Each panel is labeled from a to d in the top-right corner. In each panel a 325 MHz contour map is overlaid for reference. The contour levels are (3, 9, 39, 165)×0.7 mJy/beam. The size of the circular beam for the color and contour maps is 45″. Panel a: Spectral age map of the outer double. The gray line marks a slice through the source. The age profile, which was created this way, is shown in Fig. 7. Panel b: χred2 map of the outer double. The regions with χred2 > 3.32 (99% confidence interval) are marked in red. Panel c: Spectral age 1σ upper error map of the outer double. Panel d: Spectral age 1σ lower error map of the outer double. |
Up to 25% of flux density in C-band may be missing in the most diffuse regions of the outer doubles due to the insufficient coverage of the (u,v) plane. Thus, we repeated the modeling while increasing C-band flux density by 25%. This operation allowed us to bring the age estimates in the oldest parts of the lobes and in the remainder of the lobes’ volumes into agreement. We conclude that the reported 1σ errors of spectral ages might be underestimated by ∼30–50% in the most diffuse regions of the radio lobes. Since re-scaling different parts of radio maps by arbitrary factors could be a source of errors; hereafter, we only use the initial, un-scaled versions.
It is also necessary to note that the analysis we present in the following sections is based on simple linear extrapolation of the spectral age estimates, which might be inaccurate, as ultimately we only have direct measurements of flux densities across the entire frequency range in the brightest and youngest regions of the radio lobes.
2.4. Dynamical modeling method
The DYNAGE method of dynamical modeling, complementary to the models of spectral aging, was presented by Machalski et al. (2007) and is based on the models of Kaiser & Alexander (1997) and Kaiser et al. (1997). It assumes that the expansion of the cocoon along the jet axis is determined by the pressure of the hot-spot plasma and the lateral expansion of the lobes is guided by the internal pressure of the radio cocoon. The modeling method is explained in full in Machalski et al. (2007). The parameters required by the model that can be derived from the observations are: redshift, length of the lobes, axial ratio, and a set of flux density measurements at specified frequencies. There is also a number of free parameters that need to be assumed. In our choice of these free parameters, we followed the reasoning presented in previous such studies (e.g., Machalski et al. 2007, 2021) made on larger samples of RGs to enable an easier comparison of our results with other studies. The parameters of the radial power-law external medium density profile ρ(r) = ρ0(r/a0)−ε are a0 = 10.0 kpc and ε = 1.5; 0.1, where 1.5 is used to describe the ambient medium in the original phase of activity and, 0.1 is used for the relic cocoon interior in the restarted phase. The central density of the external medium, ρ0, is one of the parameters recovered from the modeling. The cut-off energies in the electron energy density distribution are assumed as γmin = 1 and γmax = 107. The adiabatic indices of the external medium and the cocoon matter are Γx = Γc = 5/3. The inclination to the line of sight is assumed to be 90° which the studied sources mostly comply with (see Sect. 4). Finally, an equipartition of particle and magnetic field energy densities is assumed. From the model we can recover the jet power, Qj, the central density of the external medium, ρ0, the internal pressure of the cocoon, pc, and an independent estimation of the RG age, tdyn. Due to the limitations of the method, we selected at most six measurements of the full radio lobe brightness, which provided the best fit, for every pair of lobes. To account for the old parts of lobes that are not visible at high frequencies, we recalculated the flux density uncertainties considering the maximum solid angle of the radio lobes as they are seen at low frequencies, according to the equation
 (4)
(4)
where Sν is the flux measurement at a given frequency, Ωlobe is the angular extent of the radio lobe, and Ωbeam is the beam size. The measurements are dominated by flux density scale calibration uncertainty, which is the first part of the equation.
Overall, the error of the age estimation dependent on the injection spectral index uncertainty dominates over the errors arising from an arbitrary choice of the free parameters (see the diagnostic diagrams in Machalski et al. 2007). The choice of the electron energy density distribution limits γ could change the value of the dynamical age by up to ∼40% for low values of αinj, for αinj ≳ 0.55 the influence of γ limits is marginal. Varying the inclination angle of the jet axis between 60° and 90° changes the age by at most ∼20%. The parameter related to the RGs’ environment ε varied between 0.6 and 2 can influence the result by another ∼40%. By comparison, an uncertainty of Δαinj ≃ 0.1 (similar to the uncertainties given in Table 1) could result in a factor of 2 error in the age estimation, which corresponds to about 0.3 dex error of log(Qj), 1 dex error of log(ρ0), and 0.8 dex error of log(pc).
3. Results: Spectral age maps
Both JP and JP-Tribble models were used for the spectral age modeling. In this section and in Figs. 3, 4, and 5, we present the models that provided better fits for each specific region. There are slices made through the spectral age maps, marked in gray in Figs. 3, 4, and 5, and the complementary error maps that allowed us to recover the spectral age profiles along the inferred jet axes of the individual sources. We investigate these age profiles in Sect. 4.2.
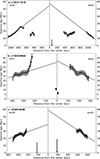 |
Fig. 7. Spectral age profiles of the three RGs made along the slices marked in Figs. 3, 4, and 5, and the complementary error maps. Each panel is labeled from a to c in the top-left corner. The points, where χred2 is high (marked in red in according panels in Figs. 3, 4, and 5) were omitted. Panel a: Spectral age profile of J1021+1216. Points mark the measurements taken from the low-resolution maps, squares mark the measurements taken from the high resolution maps, and the star marks the CI spectral age of the core extension modeled with integrated flux densities. Black lines mark the best-fit constant-speed expansion model of the outer lobes. The fit was made using the low resolution data. Panel b: Spectral age profile of J1528+0544. Points mark the measurements taken from the low-resolution maps, stars mark the points excluded from the fitting, and squares mark the CI spectral ages of the inner lobes modeled with integrated flux densities. Black lines mark the best-fit constant-speed expansion models of the outer lobes. Panel c: Spectral age profile of J2345–0449. Points mark the measurements taken from the low-resolution maps, and squares mark the spectral ages of the inner lobes, which were modeled as single regions, at the positions of their hot spots. Solid lines mark the best-fit constant-speed expansion model of the outer lobes. |
The analysis of the best-fit injection spectral indices, αinj, (Table 1) shows differences in the values of the parameter between the phases of activity in all three sources. Konar & Hardcastle (2013) describe a correlation between the αinj in the subsequent phases of activity in DDRGs, where the αinj values stay similar even after a period of quiescence (although there are exceptions to this rule, e.g., Joshi et al. 2011; Konar et al. 2013). Using the complementary correlation between the αinj and jet power, where the powerful jets are usually tied to steeper values of αinj, as the jet power could influence the strength of the jet termination shock and the efficiency of the particle acceleration mechanism, the authors argue that a deviation from these correlations may be a result of a significant change of the central SMBH mass or spin, for example as a result of black hole merging. It could also be a natural occurrence in very low-power FRII radio sources. In the general population, the modeled values of αinj are in the range 0.5–0.9 (e.g., Jamrozy et al. 2008; Konar & Hardcastle 2013, and references therein). In comparison, the spectra in the J1021+1216 inner double and in the J1528+0544 outer double appear to be rather flat (αinj ≃ 0.4), although they match the general population within the uncertainties (Table 1).
3.1. J1021+1216
In the outer double of J1021+1216 (Fig. 3), modeled with the JP method, the spectral age changes gradually from the youngest < 10 Myr regions at the edges to the oldest ∼25 Myr regions where the inner double emission begins mixing with the relic emission. The errors in most of the volume are within the range ±2 Myr. There are regions of very young 0 Myr emission at the tips of the lobes. In the part of the spectrum at frequencies much lower than the break frequency, the random statistical spread of the flux density measurements may dominate over the curvature of the spectrum (see, e.g., the plots of the J2345–0449 inner double in Fig. 2). This leads to inaccuracies of the modeling that are not reflected in the spectral age uncertainties. This effect manifests usually as sharp gradients of spectral age in young regions in the spectral age maps (just like in Fig. 3, panel a). In J1021+1216 outer double this effect appears at ≲8 Myr (based on Eq. (3), radiative age of 8 Myr is equivalent to νbr ≃ 40 GHz for magnetic field B = 0.3 μG), around the relic hot spots. For this reason, we deemed the results of the modeling in these regions unreliable and excluded them from further analysis.
In determining the properties of the J1021+1216 inner double, we favored the high-resolution JP model, presented in Fig. 3. In this model, the eastern inner lobe lacks any ordered structure, with the age ranging from 0 Myr to ∼20 Myr. In a significant portion of this lobe, particularly at the edges where S/N ratio is low, the quality of fit is very poor. For this reason, we focused primarily on the western lobe hereafter. The western lobe is the youngest roughly at its geometric center, along the inferred jet axis in the regions where the emission is the strongest, with the age ∼10–15 Myr and gets older toward the edges. At the very edges of the inner double, where the spectral age exceeds ∼20 Myr, the quality of the fit is low, most likely due to relatively low S/N and the influence of residual relic emission. The spectral age errors are the highest along the jet axis and decrease toward the edges, which means that within the uncertainties the inner western lobe has a fairly uniform spectral age. It is a result similar to what is shown in the spectral index map in Paper I. The western core extension, with the CI model fitted to its integrated flux density, has an age of  Myr.
Myr.
3.2. J1528+0544
The JP model was applied to the outer double of J1528+0544 (Fig. 4). The main body of the lobes is ≳25 Myr and ages gradually toward the core to reach ∼40 Myr at the noise level cutoff. In both lobes, there is the younger ∼20 Myr trace that is visible in the spectral index maps as well (see Paper I). Along most of this structure, χred2 is noticeably higher than in the remaining part of the lobes. At the tips of both lobes, there appears a sharp gradient of spectral age at the ages ≲23 Myr (equivalent to νbr ≃ 21 GHz for B = 0.7 μG, based on Eq. (3)). To verify whether the models of the young regions are reliable, we investigated the best-fit spectra in the individual regions. Several of these spectra are shown in Fig. 6. In the regions with spectral ages ∼16 Myr the flux density measurements at the highest frequencies deviate from the extrapolated power-law spectrum by ∼20%. In the regions with spectral ages ∼12 Myr the difference is smaller, and the random spread of the measurement points dominates over the spectral curvature. We find the results in the J1528+0544 outer double with spectral ages ≲12 Myr unreliable. We expect that the sharp gradient in the regions with spectral ages ∼16–23 Myr combined with the traces of young emission running through the entire length of these lobes are not a model inaccuracy, but rather they have an underlying physical cause, which we investigate in Sect. 4. There is a small, young ≲5 Myr region at the tip of the eastern lobe that is most likely the remnant of the hot spot. The southern extension in the eastern lobe is a blended background source. Overall, the spectral age errors do not exceed ±5 Myr with the exception of the eastern hot spot complex where they reach ±9 Myr.
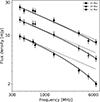 |
Fig. 6. Measurements of flux density integrated from the selected regions of J1528+0544 along with the best fit JP models (solid lines) and extrapolated power-law spectra (dashed lines) with injection index αinj = 0.39 (Table 1) plotted on a logarithmic scale. The ages of the regions are given in the plot legend. To separate the plots, the data points along with uncertainties and the best fit spectra were rescaled by factors of 0.35 and 1.5 for the 25 Myr and the 12 Myr regions respectively. |
In the J1528+0544 inner double, due to its small size, the CI model was fitted to the integrated flux densities (see Fig. 2). Following the surprisingly high spectral index of the inner lobes (see Paper I), we find that the spectral age of the eastern lobe is  Myr, and the spectral age of the western lobe is
  Myr. With the linear size of the inner double being just 18 kpc, this result means that the second phase of activity was quenched, and the small core extension, described in Paper I (and also marked in Fig. 1), could indeed be a rejuvenated phase of activity.
3.3. J2345–0449
The JP model was applied to the outer double of J2345–0449 (Fig. 5). The lobes show a clear structure of spectral aging. The age around the northern hot spot is ∼0 Myr and gradually increases toward the center to reach ∼30–40 Myr at the mask cut-off. The age of the southern hot spot is ∼10–15 Myr and increases in a way similar to what can be observed in the northern lobe. There are several regions in the oldest parts of the lobes, where the quality of the fit is low (marked in red in Fig. 5, panel b). These were excluded from further analysis. Overall the spectral age errors do not exceed ±5 Myr in most of the outer lobe volume.
Due to the rather low resolution of 25′, forced by the use of survey data, instead of presenting the spectral age map, we decided to model the inner lobes as a single region. The modeled radiative age of the inner lobes is close to 0 Myr in their entire volume. The CI spectral age of the northern inner lobe is  Myr, and the age of the southern inner lobe is
  Myr.
Myr.
Best-fit parameters of the dynamical models.
4. Discussion
4.1. Results of dynamical modeling
The results of the modeling are given in Table 2. The most notable result of the dynamical modeling is the discrepancy between the dynamical ages, tdyn, and the spectral ages of the RGs, estimated in the earlier sections. Based on the assumptions and the choice of free parameters made in Sect. 2.4, we find that the dynamical age can be as much as a few times larger than the spectral age. This is a well known (see e.g., Blundell & Rawlings 2000; Machalski et al. 2007) behavior of the two approaches. The discrepancy is typically larger for older RGs, and characterizes not only the DYNAGE code. Similar discrepancies can be found when using the ANALYTIC (Hardcastle 2018) method (see, e.g., Charlton et al. 2025). The main causes are hypothesized to be the heavy mixing of the cocoon plasma, which lowers the apparent radiative JP-model age (e.g., Turner et al. 2018), and inaccurate methods of magnetic field estimation (e.g., Mahatma et al. 2020) returning too high values, which “mistranslates” the shape of the spectrum to the radiative age, additionally broadening the gap between the two estimates. After applying the CI model with the injection indices derived from the dynamical model, αinj, dyn, to the integrated radio spectra, the resulting synchrotron ages match the dynamical ages within the ±50% uncertainty range, with the deviations being larger for the old outer doubles of J1021+1216 and J2345–0449. Due to the use of only a selection of flux density measurements instead of the full set in the modeling and due to the high uncertainties of the dynamical ages, hereafter we treat the results of spectral aging analysis (Sect. 3) preferentially over the dynamical ages.
We compared the modeled Qj, ρ0, and pc with a broader population of ∼250 RGs; of these, ∼40 are giants that were previously studied by Machalski et al. (2021). The jet power in J1528+0544 and J2345–0449 is below the population average of ⟨log(Qj [W])⟩≃38.2. The jets also appear to be weaker in the restarted phases in all three objects. Combined with the densities of the external medium in the initial phases of activity close to the average ⟨log(ρ0 [kg m−3])⟩≃ − 22.5, it results in rather low average expansion speeds v/c ≃ 0.03 in comparison with the population average of ⟨v/c⟩≃0.09. The slow expansion speeds are offset by long lifetimes of J1021+1216 and J2345–0449 as compared to the population average of ∼43 Myr, and even to the average GRG lifetime ∼110 Myr. The deciding factor behind the giant size of J1528+0544 might be recurrent activity. The source would have double the lifetime to grow to a giant size, even in the absence of other contributing factors.
We note the low internal cocoon pressures in the initial and restarted phases, which is characteristic of GRGs as compared to the general population of RGs. The external medium densities in the restarted phases are also lower than in the initial phases, which is expected as the lobes expand inside the relic cocoons. The exception in both of these cases is the restarted phase of J1528+0544. It has a log(ρ0) comparable with the initial phase of activity and log(pc) comparable with the population average ⟨log(pc [N m−2])⟩≃ − 11.7. A possible explanation is the process of buoyant detachment of the relic lobes (e.g., Kaiser et al. 2000; Biava et al. 2021) which get uplifted by the pressure gradient of the ambient medium. In such a process, the ambient medium would at least partially (as the process may take up to ∼100 Myr, Kaiser et al. 2000) replace the cocoon matter around the host galaxy and make the restarted lobes evolve in a way similar to regular FRII RGs. The values of the injection spectral index inferred from the dynamical model (αinj, dyn) are generally in agreement, within the uncertainties, with the ones found in the spectral age modeling. The dynamical model confirms the rather flat spectra of the J1021+1216 inner double and the J1528+0544 outer double. The biggest outlier in this comparison is the inner double of J2345–0449.
4.2. Spectral age profiles
4.2.1. J1021+1216
The spectral age profiles for all three RGs are presented in Fig. 7. Constant-speed expansion models of the radio lobes were fitted. The parts of the J1021+1216 outer double that were modeled follow the model well, with the expansion velocities in the plane of the sky, defined as the inverse of the best-fit linear function slope, βT, J10out, E = 0.081 ± 0.002 and βT, J10out, W = 0.079 ± 0.002 for the eastern and western lobe respectively. With a known inclination of the jet axis to the line of sight, θ, it is possible to derive the de-projected expansion velocity, β, by inverting the equation
 (5)
(5)
The spectral age extrapolated toward the center, assuming constant expansion speed, gives a moment in time when the initial phase of the activity begun. These extrapolated ages are tmax, J10out, E = 54 ± 1 Myr and tmax, J10out, W = 57 ± 1 Myr for the eastern and western lobe, respectively. By extrapolating the dependency in the other direction, toward the outer edges of the source, we were able to recover the approximate age of the outer hot spots. These ages are ths, J10out, E = 10 ± 1 Myr and ths, J10out, W = 8 ± 1 Myr for the eastern and western outer hot spot respectively. The 2 Myr discrepancy between the hot spot ages could be, at least partially, explained by light travel time and the travel time of jet plasma from the core to the hot spot. The western lobe is ∼100 kpc longer in projection than the eastern one, which translates to ∼0.3–0.4 Myr longer travel time, assuming the speed of the jet plasma close to c. In addition, the outer double of J1021+1216 has a projected linear size of ∼6 Mly. If the lobes deviate from the plane of the sky by ∼15° (an inclination to the line of sight θ = 75°), with the eastern one pointed toward the observer, the western lobe would be observed at a stage of evolution ∼1.5 Myr earlier, under the assumption that the process of igniting and quenching of the activity is symmetrical on both sides. Assuming the inclination, θ, is in the range 75° −90°, the de-projected lobe expansion speed βJ10out is in the range 0.079–0.082. Hereafter, we assumed a rounded-up value of 0.08. For the purposes of further analysis, we assume that for the outer double of J1021+1216 tmax, J10out = 56 ± 3 Myr and ths, J10out = 10 ± 1 Myr.
In the inner double of J1021+1216 the ages are constant along the slice (within the uncertainties). In such case, it is impossible to derive expansion velocities. Seeing that spectral index is also constant along the jet axis, we decided to adopt a single value of spectral age for the inner lobes, calculated as an average value of modeled spectral age along the slice. These values are τrad, J10in, E = 16 ± 2 Myr and τrad, J10in, W = 17 ± 2 Myr for the eastern and western lobe, respectively. One possible explanation for this non-standard age profile is that the statistical spread of the spectral age measurements made along the jet axis dominates over the aging structure due to very fast expansion of the inner double. For the purpose of further analysis, we assume that the inner double was created in the time span equivalent to the derived uncertainties of τrad, J10in, E and τrad, J10in, E, so between ∼18 Myr and ∼14 Myr ago. We perform our calculations on the western lobe, as it is more pronounced. The length of the western lobe is ∼650 kpc in projection, and it was formed over a 4 Myr period. By dividing the two values, we can recover the projected expansion speed βT, J10in ≃ 0.5. Since the ages of the two lobes are similar within the uncertainties, we conclude that the inner double is oriented mostly in the plane of the sky, so that the de-projected expansion speed is βJ10in ≃ 0.5. For the J1021+1216 inner double, we took tmax, J10in = 18 Myr and tmin, J10in = 14 Myr. Considering that the distance the ejected plasma must travel from the AGN to reach the tips of the inner double is ∼2 Mly, the switch-off in this phase of activity must have occurred around toff, J10in = 16 Myr ago.
In the core extension, which we interpret as the third phase of activity, only the western structure is visible. In order for the potential eastern counterpart to disappear in the noise due to Doppler dimming, β cos θ > 0.28 is required, according to the equation
 (6)
(6)
Considering the possibility that the projected linear size of the eastern counterpart is so small that the lobe is blended with the core at the available resolution, the estimate β cos θ > 0.67, derived from the equation
 (7)
(7)
is even higher. The two above equations are only correct if both lobes: (1) expand with the same velocity; (2) expand along the same axis; and (3) have the same intrinsic luminosities and linear sizes. The average expansion speed in the third phase of activity, β3p, must be at least 0.28 with an extreme inclination ≲10°. After assuming the upper limit of β3p = 1, we obtain a more reasonable θ3p ≃ 70°. Thus, we expect that β3p is likely much higher than the estimated lower limit or that the above assumptions are not fulfilled in the case of the J1021+1216 third phase of activity. The minimum age of the structure is 0.2 Myr, calculated by dividing the size of the inner structure ∼60 kpc by the assumed expansion speed.
4.2.2. J1528+0544
In parts of the J1528+0544 outer lobes, there are plateaus of spectral age (of ∼25 Myr). The western lobe, within the uncertainties, follows the linear trend. In the eastern lobe, close to the core, the deviations are significant. The spectral age raises quickly. This is most likely the result of the flux density loss issue mentioned in Sect. 2.3. After increasing the C-band flux density by 25%, the spectral age estimates in the regions marked as stars in Fig. 7 changed to 30–35 Myr, in agreement with the remainder of the lobe volume. It is also possible that the influence of the adiabatic expansion caused an additional loss of the particle energy, which is unaccounted for in the applied models, and resulted in an artificially older spectral age. In either case, the points with spectral ages > 35 Myr are unreliable and were excluded from the analysis. The best-fit projected expansion velocities are βT, J15out, E = 0.08 ± 0.02 and βT, J15out, W = 0.05 ± 0.01 in the eastern and western lobe, respectively. There is a noticeable discrepancy of βT in the opposite lobes, while ths, J15out are similar within the uncertainties, ths, J15out, E = 23 ± 3 Myr and ths, J15out, W = 21 ± 3 Myr in the eastern and western lobes, respectively, which suggests no difference due to the travel time of light. We conclude that the outer double is oriented close to the plane of the sky and the observed asymmetry in the linear sizes and βT of the outer lobes is due to the influence of an inhomogeneous ambient medium. The extrapolated ages of the hot spots contradict the directly measured age at the tips of the lobes of ∼10 Myr. One possibility is that the jets in the initial phase of activity suddenly decelerated from 0.05–0.08c to 0.015c, calculated by dividing the size of the young region ∼50 kpc by the difference of the spectral ages ∼12 Myr. Simple dynamical considerations (e.g., the equations describing the change of the jet length in time: Kaiser & Alexander 1997; Machalski et al. 2007) suggest that to cause such a deceleration, the medium density would have to increase by over two orders of magnitude symmetrically on both sides of the RG, which we do not find likely. Another explanation for the discrepancy between the extrapolated and measured hot spot age could be the variations of magnetic field strength across the lobe. Using Eq. (3), we find that it would require magnetic field strengths at the tips of the lobes to be about an order of magnitude higher to make the gradient of the spectral age smooth. This is a much higher variation than the ones observed in previous spectral aging studies (e.g., Jamrozy et al. 2008; Nandi et al. 2010; Konar et al. 2013). There is also the matter of the modeling inaccuracy mentioned already in Sect. 3. While it does influence the results for the young ≲10 Myr regions, it does not explain the sharp gradient in the spectral age profiles for the ages ∼20 Myr. After refuting the above possible explanations, we conclude that the discrepancy between the extrapolated and measured ages at the tips of the J1528+0544 outer lobes, combined with traces of young emission in the outer double, is possibly the result of an “intermediate” phase of activity. A restarted jet passed through the entire length of the relic cocoon rejuvenating the plasma along its path. At some point it reached the edge of the cocoon and started injecting plasma into the external thermal medium, creating the low-age tips. The extrapolated ages at the center are tmax, J15out, E = 40 ± 3 Myr and tmax, J15out, W = 42 ± 3 Myr. For the purpose of further analysis, we assume tmax, J15out = 41 ± 4 Myr and the age of the hot spots in the initial phase of activity ths, J15out, W = 22 ± 4 Myr.
The inner double of J1528+0544 is too small to show any internal structure at the available resolution. The average spectral ages (given in Fig. 7) were modeled using the integrated flux densities. Their values are  Myr and
  Myr. The inner hot spots are located at a distance of ∼9 kpc from the core. It is possible to roughly estimate the lower limit of the projected expansion velocity in the inner lobes of J1528+0544 by dividing their projected linear size by their radiative age. The values are βT, J15in, E = 0.002 and βT, J15in, W = 0.004. These estimates are low, especially for radio lobes that expand inside of a relic radio cocoon created during the initial phase of activity. Since the parameters derived from the dynamical modeling (Sect. 4.1) are similar in the two phases of activity, we expect the inner lobes to have β similar as in the outer double, which is only possible if the J1528+0544 inner double has an extreme inclination θ < 10°, based on the Eq. (5). This result may serve as a confirmation that the restarted phase of activity in J1528+0544 is already quenched. Judging by how symmetrical the inner double appears in the radio maps (Paper I), we conclude that βJ15in was likely significantly higher than the estimated lower limit of βT, J15in.
4.2.3. J2345–0449
In J2345–0449, both outer lobes follow the constant-speed expansion model within the uncertainties. The fitted projected expansion velocities are  and βT, J23out, S = 0.07 ± 0.01 in the northern and southern lobe respectively. Combined with their asymmetry in length and brightness, where the shorter lobe is brighter, this result suggests that the inhomogeneity of the ambient medium plays an important part in the large scale evolution of the radio structure. The extrapolated ages at the center are tmax, J23out, N = 39 ± 2 Myr and tmax, J23out, S = 59 ± 2 Myr. Since the results for the southern lobe are closer to the CI age
  Myr modeled using the integrated flux densities (see Fig. 2), due to the high discrepancy between the two estimates, we decided to use only the age of the southern lobe in further analysis. The extrapolated hot spot ages are ths, J23out, N = 19 ± 2 Myr and ths, J23out, S = 15 ± 2 Myr in the northern and southern hot spot respectively. Similarly to the case of J1021+1216, the discrepancy may be due to the light travel time and the travel time of jet plasma. An inclination to the line of sight ∼50° −60° is required to bring the two values to agreement. Here we compare spectral ages of the hot spots within 1σ errors, so the estimates of the inclinations are treated as extreme cases. The ages of the hot spots are in agreement within the 3σ errors, so we conclude that the outer doubles of all three RGs are oriented roughly within the plane of the sky. From Eq. (5), we find that the southern lobe expanded with an average de-projected velocity of 0.08c–0.09c.
In the northern inner lobe of the J2345–0449 inner double, with a projected length ∼220 kpc, the radiative age is  Myr, and in the southern lobe, with a projected length ∼180 kpc, the age is
  Myr. The estimated lower limits of projected expansion velocities, calculated by dividing the projected linear sizes of the lobes by the upper limits of the radiative ages, are βT, J23in, N ≈ 0.05 and βT, J23in, S ≈ 0.03 for the northern and southern lobe respectively. The best fit for the southern lobe τrad, J23in, S = 2 Myr translates to expansion speed βT, J23in, S ≈ 0.29.
4.3. Active and quiescent phase durations
In determining the durations of active and quiescent phases, it is necessary to consider the age of the oldest and youngest regions in a given radio lobe, which in case of the three objects would be the extrapolated central age, tmax, assumed to be the moment of the AGN switch-on, and the extrapolated hot spot age, ths, assumed to be the time elapsed since the acceleration of the final droplet of plasma that reached the hot spot. After the moment of the AGN switch-off, toff, the plasma that was ejected from the core requires some time, tjet, to reach the hot spot. This time is dependent on the distance from the core to the hot spot and the bulk velocity of the jet plasma, hereafter assumed to be close to c. Throughout the time, tjet, the hot spot is still provided with fresh particles. To derive toff, the ths values must be corrected by tjet, so that toff = ths + tjet. The duration of a single phase of activity is then tphase = tmax − toff. The duration of the quiescent phase is the difference between the switch-off time of the first phase of activity and the switch-on time of the second phase of activity tqui = toff, ph1 − ton, ph2 = toff, ph1 − tmax, ph2. The evolution history of the three DDRGs is summarized in Table 3 and in Fig. 8. Hereafter, we based our results on absolute values, whereby a greater positive value refers to an event further in the past.
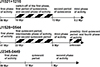 |
Fig. 8. Graphs showing the time lines (not to scale) for all three sources, collecting all the spectral age estimates presented in Sect. 4. For the sake of clarity, the spectral age uncertainties were omitted. The dashed areas indicate the periods where the exact placement of the events in time is uncertain. |
In the case of J1021+1216, the travel time of plasma from the core to the outer-double hot spots is ∼3 Myr, assuming a small deviation from the plane of the sky. The switch-off in the initial phase of activity occurred at toff, J10out = 13 ± 1 Myr ago. The duration of the original phase of activity in J1021+1216 is then tJ10out = tmax, J10out − toff, J10out = 43 ± 4 Myr. In the inner double, both lobes have an approximately constant age 16 ± 2 Myr. The switch-on in this phase of activity likely happened about tmax, J10in = 18 Myr ago, while the switch-off occurred about toff, J10in = 16 Myr ago. These results are at odds with the switch-off time of the outer double. Between 18 Myr ago and 13 Myr ago, there occurred the first quiescent period and the entirety of the second phase of activity, with the exact timeline unknown. The duration of the third phase of activity is  Myr. The calculation of the second quiescent phase duration is straightforward
  Myr. Since the start of the first phase of activity 56 Myr ago, J1021+1216 has spent at least 70% of its lifetime being active.
The intermediate phase of activity in J1528+0544, which left the rejuvenated trace in the outer lobes, is difficult to accurately isolate and describe individually; thus, we only have a general idea of this galaxy’s history. The duration of the initial phase of activity is well-constrained tmax, J15out = 41 ± 4 Myr and ths, J15out = 22 ± 4 Myr. After correcting for the travel time of plasma, we get the switch-off time toff, J15out = 23 ± 4 Myr. The duration of the initial phase of activity is then tJ15out = 18 ± 8 Myr. The approximate age of the inner double, taken as the average of both lobes’ age, is τrad, J15in = 9 ± 3 Myr. The intermediate phase of activity must have occurred between 26 Myr and 6 Myr ago, not accounting for the durations of the quiescent phases. The direct measurement of the spectral age at the heads of the outer lobes, which would be injected entirely in the intermediate phase of activity, is  Myr. The switch-off likely happened
  Myr. The maximum possible duration of the intermediate phase is ∼23 Myr and would correspond to an average expansion speed ∼0.06c, which is rather low, considering that the jet moved through the interior of a relic cocoon. It is likely that the portion of of this period was spent by J1528+0544 in two quiescent phases. The second quiescent period lasted
  Myr. With the available data we cannot constrain the duration of the first quiescent phase.
In J2345–0449 the switch-off time in the initial phase of activity is toff, J23out = 17 ± 2 Myr, taken as the age of the southern hot spot with an additional 2 Myr accounting for the travel time of the jet plasma from the AGN to the hot spot, which makes the duration of the first activity phase tJ23out = 42 ± 4 Myr. The minimum possible age of the inner double, considering its expansion at the speed close to c, is ∼1 Myr. The average modeled age of the inner lobes is  Myr. The duration of the quiescent phase is
  Myr. Since the start of the first phase of activity, this galaxy has spent at most ∼35% of its total lifetime in an inactive state.
4.4. The mechanisms of GRG growth
In case of J1021+1216, the most likely explanation of its giant size is the long lifetime of the initial phase of activity, manifesting in both spectral aging analysis and dynamical modeling (see Table 2). Its spectral age tJ10out = 43 ± 4 Myr is almost double the average ∼23 Myr found in the spectral aging study of GRGs (Jamrozy et al. 2008), and the dynamical age tdyn, J10out = 250 Myr is over double the average ∼110 Myr in the GRG sub-sample of Machalski et al. (2021). The inner double of J1021+1216 grew to its giant size due to fast expansion, at a speed βJ10in ≃ 0.5 (which typically does not exceed ∼0.1–0.15: Scheuer 1995; Arshakian & Longair 2000), in a low-density medium; namely, the interior of the relic cocoon. The primary reason behind the growth of J2345–0449 outer double is the long lifetime as well. The active phase duration tJ23out = 42 ± 4 Myr is almost 70% higher than the GRG average (Jamrozy et al. 2008), and the corresponding dynamical age tdyn, J23 = 176 Myr is ∼60% higher than the GRG average age (Machalski et al. 2021).
In J1528+0544 most of the parameters that govern the growth of radio structures are not out of the ordinary. Jet power, density of the external medium, duration of the active phase, and expansion speed are all either close to (or even lower) than the average values found in the general population. However, the structure observed in the spectral age map of the outer double (Fig. 4) suggests that there was an intermediate phase of activity. It initially expanded on the interior of the relic cocoon created in an earlier phase of activity (stretching between ∼41 Myr and ∼23 Myr ago), leaving a trace of rejuvenated plasma. At the very end of the intermediate phase, the jet reached the external thermal medium and started injecting plasma directly into it. The process extended the length of the outer lobes and created a high contrast of the observed spectral age at the heads of the outer lobes as compared to their main body (the process is illustrated in Fig. 9). This behavior of J1528+0544 directly follows the predictions of Brocksopp et al. (2011).
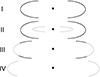 |
Fig. 9. Suggested model of radio-galaxy growth stimulated by recurrent activity. The core is marked with a black dot. The lobes created in the original phase of activity are marked in black, and the lobes created in the restarted phase of activity are marked in gray. Phase I: FRII RG in its original phase of activity. Phase II: RG after the AGN activity got quenched and restarted. The inner double (gray) propagates on the interior of the relic cocoon (black). Phase III: Restarted jet reaches the thermal medium on the outside of the relic cocoon. The evolution in the restarted phase continues in a way similar to a regular FRII RG. The relic matter becomes an “extension” of the newly formed double. A contrast of spectral age between the head and the extension should be observed. Phase IV: Restarted phase continues the growth. The relic matter expends so much energy that it can no longer be observed. The RG appears as a single-double. According to this model, J1528+0544 reached phase III before the restarted activity in the “intermediate” phase became quenched. |
5. Conclusions
In this study, we carried out a multifrequency analysis of three giant DDRGs: J1021+1216, J1528+0544, and J2345–0449. Using the collection of radio maps, we prepared models of dynamical and spectral aging in the outer and inner doubles of these sources. Based on the estimations of jet powers, external medium densities, and active phase durations, we conclude that there is no single universal factor stimulating the growth of the giant radio sources. In the J1021+1216 and J2345–0449 outer doubles, the main reasons behind their gigantic sizes are their long lifetimes. In J1021+1216 inner double, which is also a giant itself, it is the fast expansion in a low-density medium. In J1528+0544, it appears that the growth was distributed between two separate phases of activity occurring one after another, in accordance with the model of Brocksopp et al. (2011).
Furthermore, we report the discovery of two RGs with three separate phases of activity visible at once, namely, J1021+1216 and J1528+0544. We argue that the phase of activity in J1528+0544 causing the inner 18 kpc double is already quenched and that the core extension visible in high-resolution maps results from a new (fourth) phase of activity. Very long baseline interferometric observations would be necessary to image the core extensions in J1021+1216 and J1528+0544 at an appropriate resolution and to search for any traces of counter-jets.
In the observations of the J2345–0449 inner double, we were limited to a maximum frequency of just 5 GHz, which resulted in a high uncertainty for the spectral age estimation. The additional availability of high-resolution VLA data in bands X (8–12 GHz), Ku (12–18 GHz), and K (18–26 GHz) collected in several array configurations would make it possible to accurately model the radio continuum of the J2345–0449 inner double and to set tighter constraints on its spectral age.
Acknowledgments
We would like to thank J. Machalski for preparing the dynamical models of the outer and inner lobes in our study, using the DYNAGE code (Machalski et al. 2007), and an anonymous referee for valuable suggestions. This research work was partially supported by the National Science Center (NCN) OPUS-15 grant, no. UMO2018/29/B/ST9/01793. We thank the staff of the GMRT that made these observations possible. GMRT is run by the National Center for Radio Astrophysics of the Tata Institute of Fundamental Research. This work has also used the Karl G. Jansky Very Large Array operated by the National Radio Astronomy Observatory (NRAO). The NRAO is a facility of the National Science Foundation operated under cooperative agreement by Associated Universities, Inc.
References
- Ahn, C. P., Alexandroff, R., Allende Prieto, C., et al. 2012, ApJS, 203, 21 [Google Scholar]
- Andernach, H., Jiménez-Andrade, E. F., & Willis, A. G. 2021, Galaxies, 9, 99 [NASA ADS] [CrossRef] [Google Scholar]
- Arshakian, T. G., & Longair, M. S. 2000, MNRAS, 311, 846 [NASA ADS] [CrossRef] [Google Scholar]
- Bagchi, J., Vivek, M., Vikram, V., et al. 2014, ApJ, 788, 174 [NASA ADS] [CrossRef] [Google Scholar]
- Biava, N., Brienza, M., Bonafede, A., et al. 2021, A&A, 650, A170 [NASA ADS] [CrossRef] [EDP Sciences] [Google Scholar]
- Blundell, K. M., & Rawlings, S. 2000, AJ, 119, 1111 [NASA ADS] [CrossRef] [Google Scholar]
- Brienza, M., Rajpurohit, K., Churazov, E., et al. 2025, A&A, 696, A239 [NASA ADS] [CrossRef] [EDP Sciences] [Google Scholar]
- Brocksopp, C., Kaiser, C. R., Schoenmakers, A. P., & de Bruyn, A. G. 2007, MNRAS, 382, 1019 [NASA ADS] [CrossRef] [Google Scholar]
- Brocksopp, C., Kaiser, C. R., Schoenmakers, A. P., & de Bruyn, A. G. 2011, MNRAS, 410, 484 [CrossRef] [Google Scholar]
- Capetti, A., Zamfir, S., Rossi, P., et al. 2002, A&A, 394, 39 [NASA ADS] [CrossRef] [EDP Sciences] [Google Scholar]
- CASA Team (Bean, B., et al.) 2022, PASP, 134, 114501 [NASA ADS] [CrossRef] [Google Scholar]
- Charlton, K. K. L., Delhaize, J., Thorat, K., et al. 2025, MNRAS, 537, 272 [NASA ADS] [CrossRef] [Google Scholar]
- Chavan, K., Dabhade, P., & Saikia, D. J. 2023, MNRAS, 525, L87 [NASA ADS] [CrossRef] [Google Scholar]
- Dabhade, P., Combes, F., Salomé, P., Bagchi, J., & Mahato, M. 2020, A&A, 643, A111 [NASA ADS] [CrossRef] [EDP Sciences] [Google Scholar]
- Dabhade, P., Saikia, D. J., & Mahato, M. 2023, JApA, 44, 13 [NASA ADS] [Google Scholar]
- Dabhade, P., Chavan, K., Saikia, D. J., Oei, M. S. S. L., & Röttgering, H. J. A. 2025, A&A, 696, A97 [NASA ADS] [CrossRef] [EDP Sciences] [Google Scholar]
- Gopal-Krishna, Wiita, P. J., & Saripalli, L. 1989, MNRAS, 239, 173 [NASA ADS] [CrossRef] [Google Scholar]
- Gopal-Krishna, Biermann, P. L., Gergely, L., & Wiita, P. J. 2012, Res. Astron. Astrophys., 12, 127 [NASA ADS] [CrossRef] [Google Scholar]
- Gupta, Y., Ajithkumar, B., Kale, H. S., et al. 2017, Curr. Sci., 113, 707 [NASA ADS] [CrossRef] [Google Scholar]
- Hardcastle, M. J. 2013, MNRAS, 433, 3364 [Google Scholar]
- Hardcastle, M. J. 2018, MNRAS, 475, 2768 [Google Scholar]
- Hardcastle, M. J., Williams, W. L., Best, P. N., et al. 2019, A&A, 622, A12 [NASA ADS] [CrossRef] [EDP Sciences] [Google Scholar]
- Hardcastle, M. J., Horton, M. A., Williams, W. L., et al. 2023, A&A, 678, A151 [NASA ADS] [CrossRef] [EDP Sciences] [Google Scholar]
- Harwood, J. J., Hardcastle, M. J., Croston, J. H., & Goodger, J. L. 2013, MNRAS, 435, 3353 [NASA ADS] [CrossRef] [Google Scholar]
- Harwood, J. J., Hardcastle, M. J., & Croston, J. H. 2015, MNRAS, 454, 3403 [NASA ADS] [CrossRef] [Google Scholar]
- Heckman, T. M., & Best, P. N. 2014, ARA&A, 52, 589 [Google Scholar]
- Hota, A., Sirothia, S. K., Ohyama, Y., et al. 2011, MNRAS, 417, L36 [NASA ADS] [CrossRef] [Google Scholar]
- Intema, H. T. 2014, ASI Conf. Ser., 13, 469 [Google Scholar]
- Jaffe, W. J., & Perola, G. C. 1973, A&A, 26, 423 [NASA ADS] [Google Scholar]
- Jamrozy, M., Konar, C., Saikia, D. J., et al. 2007, MNRAS, 378, 581 [Google Scholar]
- Jamrozy, M., Konar, C., Machalski, J., & Saikia, D. J. 2008, MNRAS, 385, 1286 [NASA ADS] [CrossRef] [Google Scholar]
- Jimenez-Gallardo, A., Massaro, F., Capetti, A., et al. 2019, A&A, 627, A108 [NASA ADS] [CrossRef] [EDP Sciences] [Google Scholar]
- Joshi, S. A., Nandi, S., Saikia, D. J., Ishwara-Chandra, C. H., & Konar, C. 2011, MNRAS, 414, 1397 [NASA ADS] [CrossRef] [Google Scholar]
- Jurlin, N., Morganti, R., Brienza, M., et al. 2020, A&A, 638, A34 [EDP Sciences] [Google Scholar]
- Kaiser, C. R., & Alexander, P. 1997, MNRAS, 286, 215 [NASA ADS] [CrossRef] [Google Scholar]
- Kaiser, C. R., Dennett-Thorpe, J., & Alexander, P. 1997, MNRAS, 292, 723 [Google Scholar]
- Kaiser, C. R., Schoenmakers, A. P., & Röttgering, H. J. A. 2000, MNRAS, 315, 381 [Google Scholar]
- Komberg, B. V., & Pashchenko, I. N. 2009, Astron. Rep., 53, 1086 [NASA ADS] [CrossRef] [Google Scholar]
- Konar, C., & Hardcastle, M. J. 2013, MNRAS, 436, 1595 [NASA ADS] [CrossRef] [Google Scholar]
- Konar, C., Jamrozy, M., Saikia, D. J., & Machalski, J. 2008, MNRAS, 383, 525 [Google Scholar]
- Konar, C., Hardcastle, M. J., Jamrozy, M., & Croston, J. H. 2013, MNRAS, 430, 2137 [NASA ADS] [CrossRef] [Google Scholar]
- Kozieł-Wierzbowska, D., Goyal, A., & Żywucka, N. 2020, ApJS, 247, 53 [CrossRef] [Google Scholar]
- Kuźmicz, A., Jamrozy, M., Kozieł-Wierzbowska, D., & Weżgowiec, M. 2017, MNRAS, 471, 3806 [CrossRef] [Google Scholar]
- Kuźmicz, A., Czerny, B., & Wildy, C. 2019, A&A, 624, A91 [NASA ADS] [CrossRef] [EDP Sciences] [Google Scholar]
- Machalski, J., Chyży, K. T., Stawarz, Ł., & Kozieł, D. 2007, A&A, 462, 43 [NASA ADS] [CrossRef] [EDP Sciences] [Google Scholar]
- Machalski, J., Kozieł-Wierzbowska, D., & Goyal, A. 2021, ApJS, 255, 22 [NASA ADS] [CrossRef] [Google Scholar]
- Mack, K. H., Klein, U., O’Dea, C. P., Willis, A. G., & Saripalli, L. 1998, A&A, 329, 431 [NASA ADS] [Google Scholar]
- Mahatma, V. H., Hardcastle, M. J., Williams, W. L., et al. 2019, A&A, 622, A13 [NASA ADS] [CrossRef] [EDP Sciences] [Google Scholar]
- Mahatma, V. H., Hardcastle, M. J., Croston, J. H., et al. 2020, MNRAS, 491, 5015 [Google Scholar]
- Mirakhor, M. S., Walker, S. A., Bagchi, J., et al. 2021, MNRAS, 500, 2503 [Google Scholar]
- Mostert, R. I. J., Oei, M. S. S. L., Barkus, B., et al. 2024, A&A, 691, A185 [NASA ADS] [CrossRef] [EDP Sciences] [Google Scholar]
- Nandi, S., Pirya, A., Pal, S., et al. 2010, MNRAS, 404, 433 [NASA ADS] [Google Scholar]
- Oei, M. S. S. L., van Weeren, R. J., Gast, A. R. D. J. G. I. B., et al. 2023, A&A, 672, A163 [NASA ADS] [CrossRef] [EDP Sciences] [Google Scholar]
- Oei, M. S. S. L., Hardcastle, M. J., Timmerman, R., et al. 2024, Nature, 633, 537 [NASA ADS] [CrossRef] [Google Scholar]
- Pacholczyk, A. G. 1970, Radio Astrophysics. Nonthermal Processes in Galactic and Extragalactic Sources (San Francisco, Freeman) [Google Scholar]
- Planck Collaboration VI. 2020, A&A, 641, A6 [NASA ADS] [CrossRef] [EDP Sciences] [Google Scholar]
- Scheuer, P. A. G. 1995, MNRAS, 277, 331 [NASA ADS] [Google Scholar]
- Schoenmakers, A. P., de Bruyn, A. G., Röttgering, H. J. A., van der Laan, H., & Kaiser, C. R. 2000, MNRAS, 315, 371 [Google Scholar]
- Simonte, M., Andernach, H., Brüggen, M., et al. 2022, MNRAS, 515, 2032 [CrossRef] [Google Scholar]
- Simonte, M., Andernach, H., Brüggen, M., Miley, G. K., & Barthel, P. 2024, A&A, 686, A21 [NASA ADS] [CrossRef] [EDP Sciences] [Google Scholar]
- Singh, V., Ishwara-Chandra, C. H., Kharb, P., Srivastava, S., & Janardhan, P. 2016, ApJ, 826, 132 [NASA ADS] [CrossRef] [Google Scholar]
- Subrahmanyan, R., Saripalli, L., & Hunstead, R. W. 1996, MNRAS, 279, 257 [NASA ADS] [CrossRef] [Google Scholar]
- Tribble, P. C. 1993, MNRAS, 261, 57 [NASA ADS] [CrossRef] [Google Scholar]
- Turner, R. J., Rogers, J. G., Shabala, S. S., & Krause, M. G. H. 2018, MNRAS, 473, 4179 [NASA ADS] [CrossRef] [Google Scholar]
- Walker, S. A., Bagchi, J., & Fabian, A. C. 2015, MNRAS, 449, 3527 [NASA ADS] [CrossRef] [Google Scholar]
- Wolnik, K., & Jamrozy, M. 2025, A&A, 704, A284 [NASA ADS] [CrossRef] [EDP Sciences] [Google Scholar]
All Tables
All Figures
|
Fig. 1. Selected total intensity contour maps of J1021+1216, J1528+0544, and J2345–0449. The panels are labeled from a to f in the bottom right corners. The beams are shown in the bottom left corners, and the middle frequencies are given at the top of the individual panels. The contour levels are (3, 6, 9, 15, 24, 39, 63, 102, 165, 267, 432) × σrms. Panel a: Low-resolution 45″ map of J1021+1216 (black) at 0.32 GHz with a high resolution 13″ map (red) at the same frequency overlaid for reference. The σrms noise levels are 0.6 mJy/beam in the low resolution map and 0.23 mJy/beam in the high resolution map. Panel b: High-resolution 13″ map of the J1021+1216 inner double at 0.32 GHz. The σrms is 0.23 mJy/beam. Panel c: Low-resolution 45″ map of J1528+0544 at 6.6 GHz. A high-resolution 1″ map of the J1528+0544 central region at the same frequency is shown in the top right corner. The σrms are 0.1 mJy/beam for the low resolution map and 0.015 mJy/beam for the high resolution map. Panel d: High-resolution 1 |
| In the text | |
|
Fig. 2. Measurements of flux density integrated from the regions used for the spectral aging analysis (see Figures 3, 4, and 5) along with the best fit continuous injection models plotted on a logarithmic scale. The best fit injection indices αinj are given in Table 1. To separate the plots in the J1021+1216 panel, the data points along with uncertainties and the best fit spectra of the eastern and western inner lobe were multiplied by 0.2 and 0.1, respectively. |
| In the text | |
|
Fig. 3. Spectral age maps of J1021+1216 outer and inner double presented as color maps, with color bars representing the scales given next to each panel. Each panel is labeled from a to h in the top-right corner. In panels a–d, a 1.4 GHz contour map is overlaid for reference. The contour levels are (3, 9, 39)×0.35 mJy/beam. The size of the circular beam for the color and contour maps is 45″. In panels e–h a 323 MHz contour map was overlaid for reference. The contour levels are (3, 9, 39)×0.23 mJy/beam. The size of the circular beam for the color and contour maps is 13″. Panel a: Spectral age map of the whole RG. The gray line marks a slice through the source. The age profile, which was created this way, is shown in Fig. 7. Panel b: χred2 map of the whole RG. The regions with χred2 > 3.02 (99% confidence interval) are marked in red. Panel c: Spectral age 1σ upper error map of the whole RG. Panel d: Spectral age 1σ lower error map of the whole RG. Panel e: Spectral age map of the inner double. The gray line marks a slice through the source. The age profile, which was created this way, is shown in Fig. 7. Panel f: χred2 map of the inner double. The regions with χred2 > 3.02 (99% confidence interval) are marked in red. Panel g: Spectral age 1σ upper error map of the inner double. Panel h: Spectral age 1σ lower error map of the inner double. |
| In the text | |
|
Fig. 4. Spectral age maps of J1528+0544 outer double presented as color maps, with color bars representing the scales given next to each panel. Each panel is labeled from a to d in the top-right corner. A 700 MHz contour map is overlaid for reference. The contour levels are (3, 9, 39, 165)×0.33 mJy/beam. The size of the circular beam for the color and contour maps is 45″. Panel a: Spectral age map of the whole RG. The gray line marks a slice through the source. The age profile, which was created this way, is shown in Fig. 7. Panel b: χred2 map of the whole RG. The regions with χred2 > 2.8 (99% confidence interval) are marked in red. Panel c: Spectral age 1σ upper error map of the whole RG. Panel d: Spectral age 1σ lower error map of the whole RG. |
| In the text | |
|
Fig. 5. Spectral age maps of J2345–0449 outer double presented as color maps, with color bars representing the scales given next to each panel. Each panel is labeled from a to d in the top-right corner. In each panel a 325 MHz contour map is overlaid for reference. The contour levels are (3, 9, 39, 165)×0.7 mJy/beam. The size of the circular beam for the color and contour maps is 45″. Panel a: Spectral age map of the outer double. The gray line marks a slice through the source. The age profile, which was created this way, is shown in Fig. 7. Panel b: χred2 map of the outer double. The regions with χred2 > 3.32 (99% confidence interval) are marked in red. Panel c: Spectral age 1σ upper error map of the outer double. Panel d: Spectral age 1σ lower error map of the outer double. |
| In the text | |
|
Fig. 7. Spectral age profiles of the three RGs made along the slices marked in Figs. 3, 4, and 5, and the complementary error maps. Each panel is labeled from a to c in the top-left corner. The points, where χred2 is high (marked in red in according panels in Figs. 3, 4, and 5) were omitted. Panel a: Spectral age profile of J1021+1216. Points mark the measurements taken from the low-resolution maps, squares mark the measurements taken from the high resolution maps, and the star marks the CI spectral age of the core extension modeled with integrated flux densities. Black lines mark the best-fit constant-speed expansion model of the outer lobes. The fit was made using the low resolution data. Panel b: Spectral age profile of J1528+0544. Points mark the measurements taken from the low-resolution maps, stars mark the points excluded from the fitting, and squares mark the CI spectral ages of the inner lobes modeled with integrated flux densities. Black lines mark the best-fit constant-speed expansion models of the outer lobes. Panel c: Spectral age profile of J2345–0449. Points mark the measurements taken from the low-resolution maps, and squares mark the spectral ages of the inner lobes, which were modeled as single regions, at the positions of their hot spots. Solid lines mark the best-fit constant-speed expansion model of the outer lobes. |
| In the text | |
|
Fig. 6. Measurements of flux density integrated from the selected regions of J1528+0544 along with the best fit JP models (solid lines) and extrapolated power-law spectra (dashed lines) with injection index αinj = 0.39 (Table 1) plotted on a logarithmic scale. The ages of the regions are given in the plot legend. To separate the plots, the data points along with uncertainties and the best fit spectra were rescaled by factors of 0.35 and 1.5 for the 25 Myr and the 12 Myr regions respectively. |
| In the text | |
|
Fig. 8. Graphs showing the time lines (not to scale) for all three sources, collecting all the spectral age estimates presented in Sect. 4. For the sake of clarity, the spectral age uncertainties were omitted. The dashed areas indicate the periods where the exact placement of the events in time is uncertain. |
| In the text | |
|
Fig. 9. Suggested model of radio-galaxy growth stimulated by recurrent activity. The core is marked with a black dot. The lobes created in the original phase of activity are marked in black, and the lobes created in the restarted phase of activity are marked in gray. Phase I: FRII RG in its original phase of activity. Phase II: RG after the AGN activity got quenched and restarted. The inner double (gray) propagates on the interior of the relic cocoon (black). Phase III: Restarted jet reaches the thermal medium on the outside of the relic cocoon. The evolution in the restarted phase continues in a way similar to a regular FRII RG. The relic matter becomes an “extension” of the newly formed double. A contrast of spectral age between the head and the extension should be observed. Phase IV: Restarted phase continues the growth. The relic matter expends so much energy that it can no longer be observed. The RG appears as a single-double. According to this model, J1528+0544 reached phase III before the restarted activity in the “intermediate” phase became quenched. |
| In the text | |
Current usage metrics show cumulative count of Article Views (full-text article views including HTML views, PDF and ePub downloads, according to the available data) and Abstracts Views on Vision4Press platform.
Data correspond to usage on the plateform after 2015. The current usage metrics is available 48-96 hours after online publication and is updated daily on week days.
Initial download of the metrics may take a while.