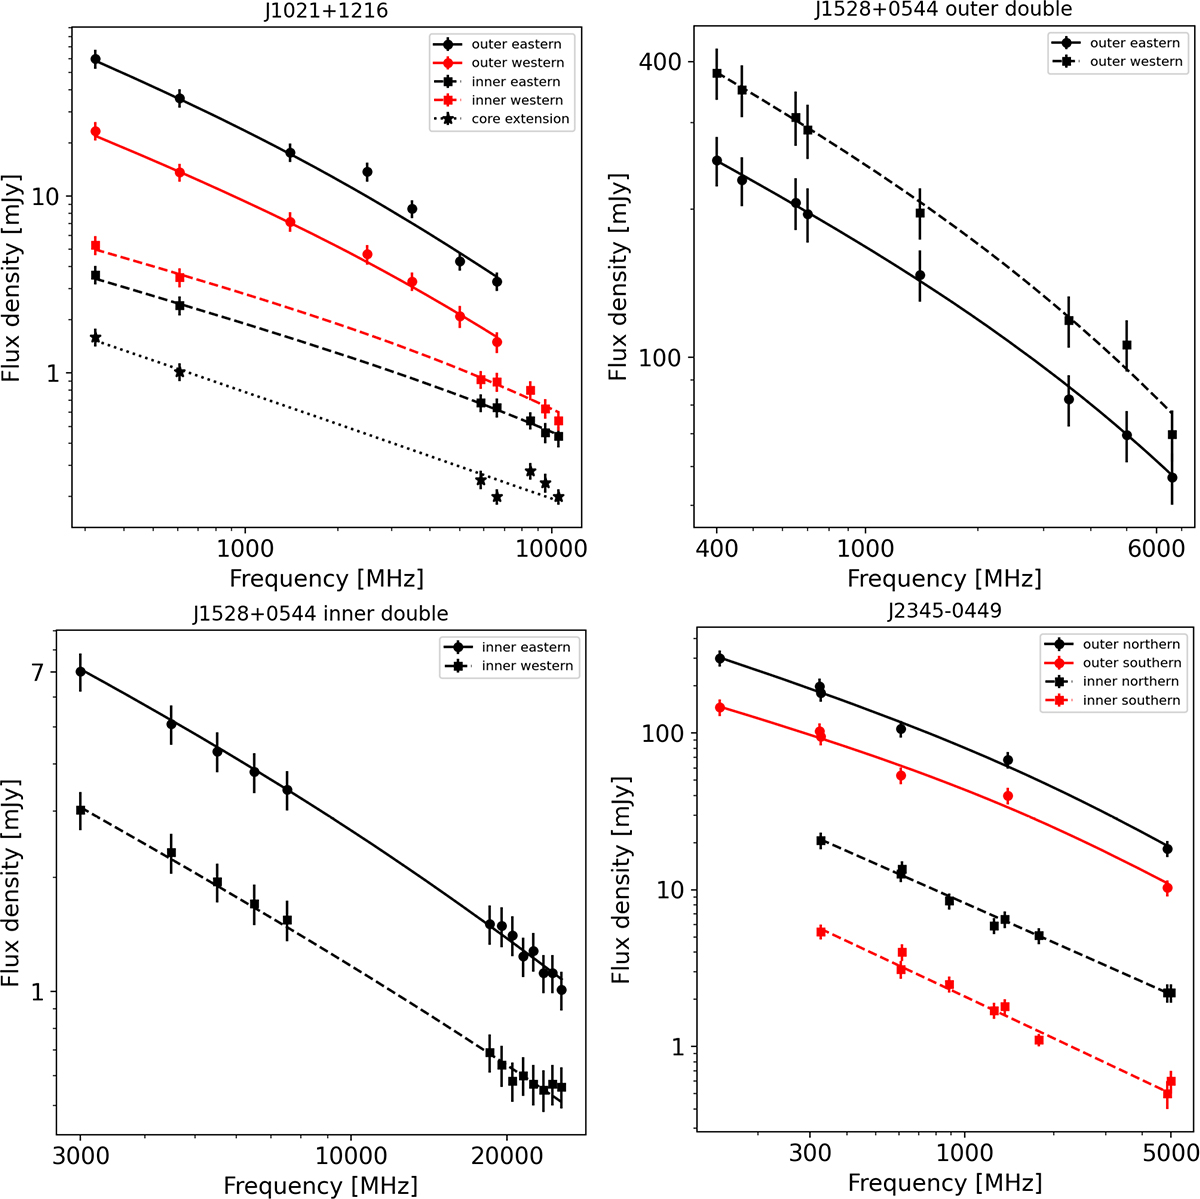
Fig. 2.
Download original image
Measurements of flux density integrated from the regions used for the spectral aging analysis (see Figures 3, 4, and 5) along with the best fit continuous injection models plotted on a logarithmic scale. The best fit injection indices αinj are given in Table 1. To separate the plots in the J1021+1216 panel, the data points along with uncertainties and the best fit spectra of the eastern and western inner lobe were multiplied by 0.2 and 0.1, respectively.
Current usage metrics show cumulative count of Article Views (full-text article views including HTML views, PDF and ePub downloads, according to the available data) and Abstracts Views on Vision4Press platform.
Data correspond to usage on the plateform after 2015. The current usage metrics is available 48-96 hours after online publication and is updated daily on week days.
Initial download of the metrics may take a while.