Fig. 3.
Download original image
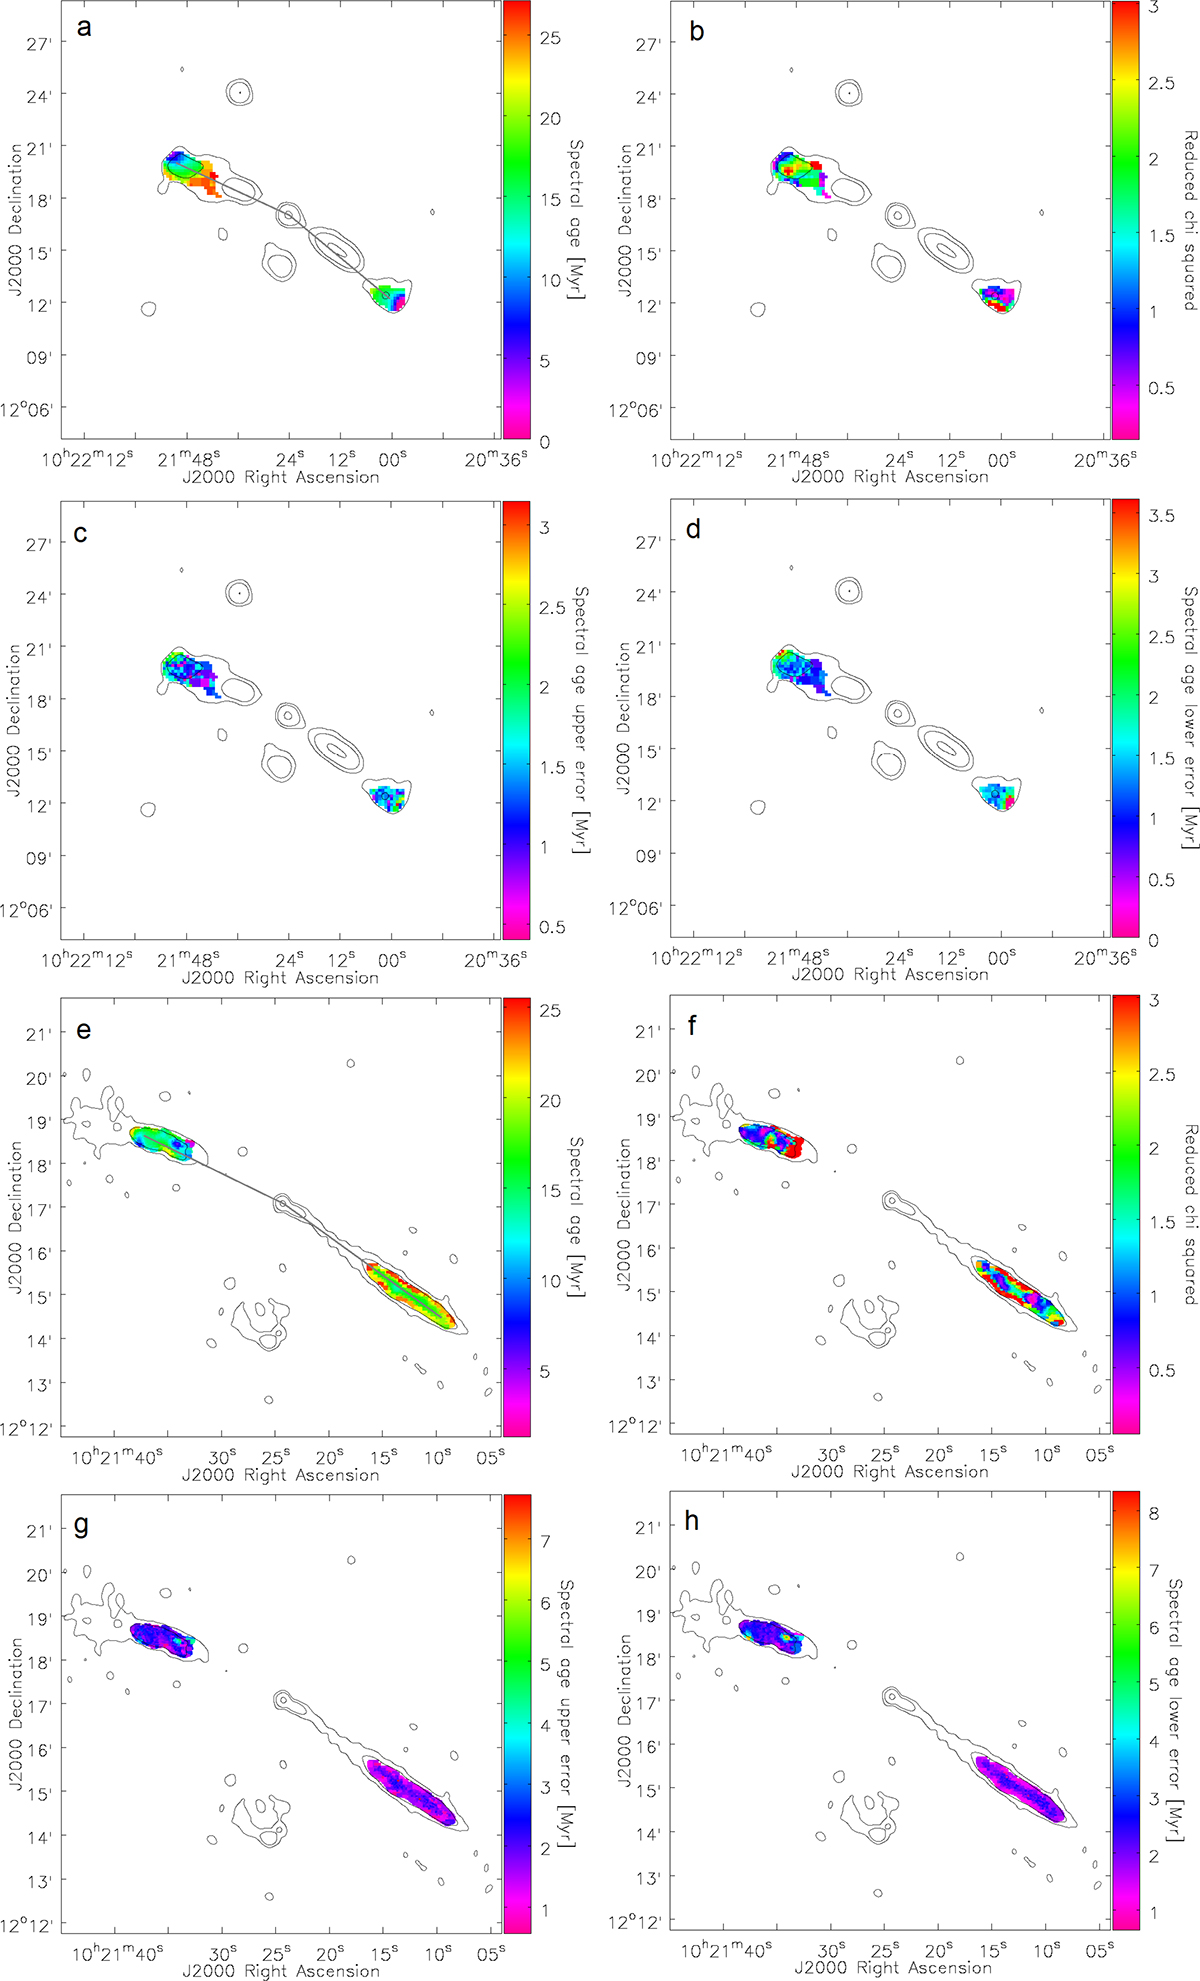
Spectral age maps of J1021+1216 outer and inner double presented as color maps, with color bars representing the scales given next to each panel. Each panel is labeled from a to h in the top-right corner. In panels a–d, a 1.4 GHz contour map is overlaid for reference. The contour levels are (3, 9, 39)×0.35 mJy/beam. The size of the circular beam for the color and contour maps is 45″. In panels e–h a 323 MHz contour map was overlaid for reference. The contour levels are (3, 9, 39)×0.23 mJy/beam. The size of the circular beam for the color and contour maps is 13″. Panel a: Spectral age map of the whole RG. The gray line marks a slice through the source. The age profile, which was created this way, is shown in Fig. 7. Panel b: χred2 map of the whole RG. The regions with χred2 > 3.02 (99% confidence interval) are marked in red. Panel c: Spectral age 1σ upper error map of the whole RG. Panel d: Spectral age 1σ lower error map of the whole RG. Panel e: Spectral age map of the inner double. The gray line marks a slice through the source. The age profile, which was created this way, is shown in Fig. 7. Panel f: χred2 map of the inner double. The regions with χred2 > 3.02 (99% confidence interval) are marked in red. Panel g: Spectral age 1σ upper error map of the inner double. Panel h: Spectral age 1σ lower error map of the inner double.
Current usage metrics show cumulative count of Article Views (full-text article views including HTML views, PDF and ePub downloads, according to the available data) and Abstracts Views on Vision4Press platform.
Data correspond to usage on the plateform after 2015. The current usage metrics is available 48-96 hours after online publication and is updated daily on week days.
Initial download of the metrics may take a while.