Open Access
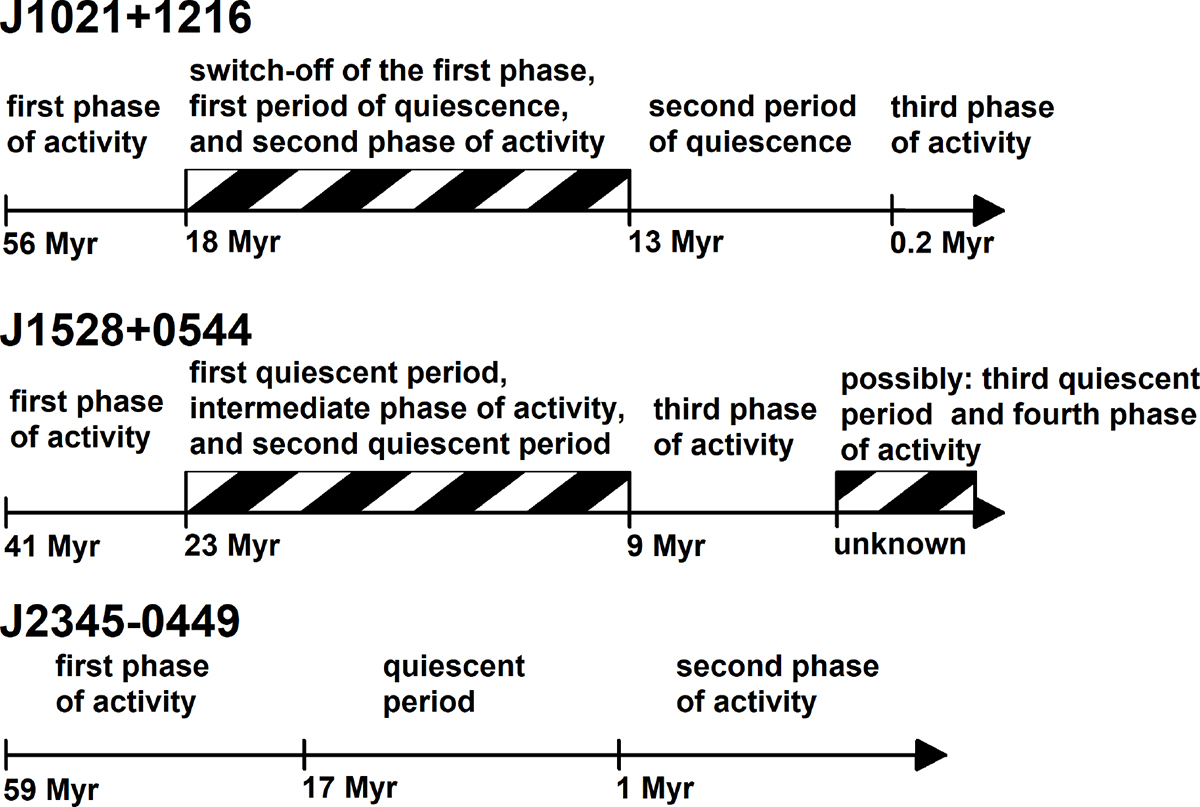
Fig. 8.
Download original image
Graphs showing the time lines (not to scale) for all three sources, collecting all the spectral age estimates presented in Sect. 4. For the sake of clarity, the spectral age uncertainties were omitted. The dashed areas indicate the periods where the exact placement of the events in time is uncertain.
Current usage metrics show cumulative count of Article Views (full-text article views including HTML views, PDF and ePub downloads, according to the available data) and Abstracts Views on Vision4Press platform.
Data correspond to usage on the plateform after 2015. The current usage metrics is available 48-96 hours after online publication and is updated daily on week days.
Initial download of the metrics may take a while.