Fig. 3.
Download original image
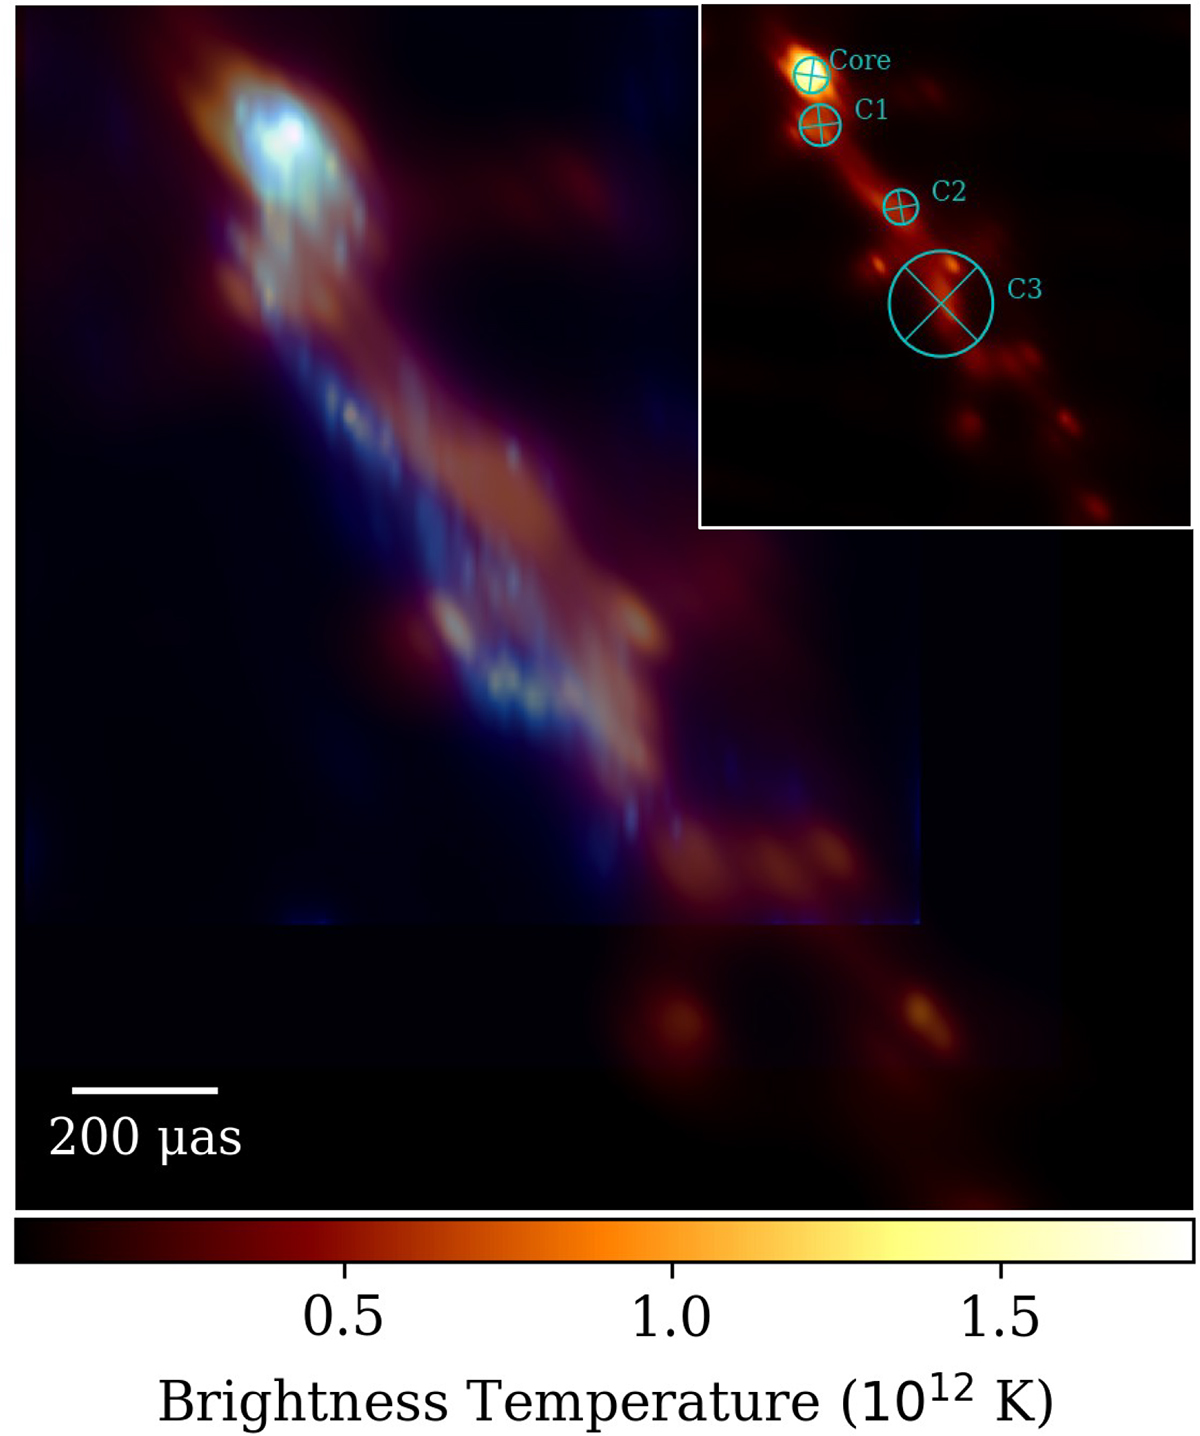
Main image: Direct comparison between the 2014 and 2018 images of 3C 279 at 22 GHz with RadioAstron. The 2018 epoch is plotted in a warm color scale afmhot and aligned with the 2014 epoch (Fuentes et al. 2023), in blue, using the brightest pixel. The inset panel shows the Gaussian components from the model fitting process overlapped onto the image. The fifth component (E) is not shown since it is a large component that is necessary to take into account the diffuse emission.
Current usage metrics show cumulative count of Article Views (full-text article views including HTML views, PDF and ePub downloads, according to the available data) and Abstracts Views on Vision4Press platform.
Data correspond to usage on the plateform after 2015. The current usage metrics is available 48-96 hours after online publication and is updated daily on week days.
Initial download of the metrics may take a while.