Fig. 11
Download original image
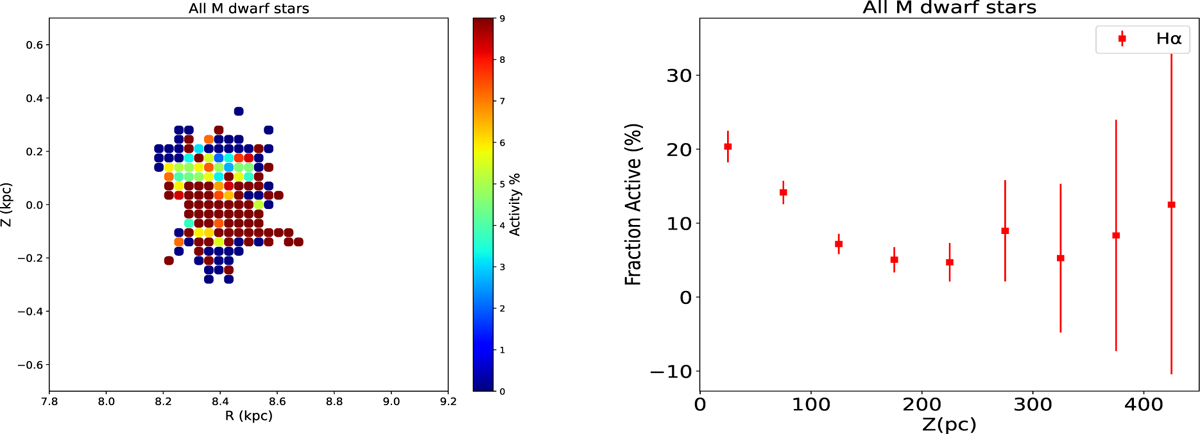
Two-dimensional and one-dimensional distribution of active stars based on the Hα line. The left panel illustrates the two-dimensional distribution of the ratio of active stars to the total number of stars in cylindrical galactocentric coordinates (R and Z), where the color indicates the active fraction. The right panel shows the relation between stellar activity proportions and the vertical distance from the Milky Way plane. The vertical red lines represent the error bars.
Current usage metrics show cumulative count of Article Views (full-text article views including HTML views, PDF and ePub downloads, according to the available data) and Abstracts Views on Vision4Press platform.
Data correspond to usage on the plateform after 2015. The current usage metrics is available 48-96 hours after online publication and is updated daily on week days.
Initial download of the metrics may take a while.