Open Access
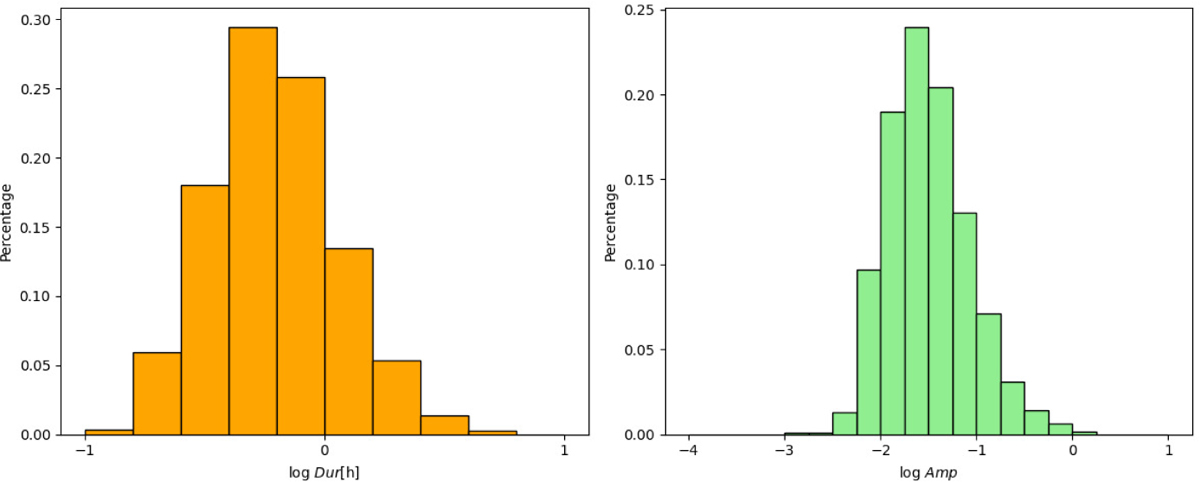
Fig. 17
Download original image
Percentage distribution of the flare event duration and amplitude in different ranges relative to the total sample. The left panel shows the distribution of the flare duration percentages, and the right panel shows the distribution of the flare amplitude percentages.
Current usage metrics show cumulative count of Article Views (full-text article views including HTML views, PDF and ePub downloads, according to the available data) and Abstracts Views on Vision4Press platform.
Data correspond to usage on the plateform after 2015. The current usage metrics is available 48-96 hours after online publication and is updated daily on week days.
Initial download of the metrics may take a while.