Fig. 19
Download original image
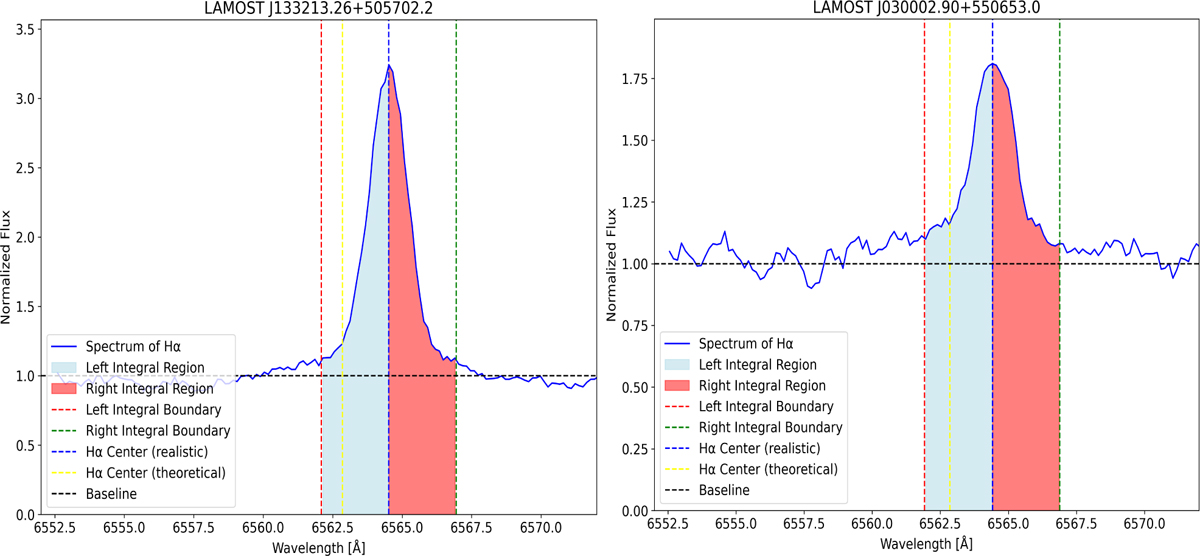
Examples of the Hα profile asymmetry in stellar redshift and blueshift integration regions for CME detection. Left: LAMOST J133213.26+505702.2. Right: LAMOST J030002.90+550653.0. The dashed red and green lines represent the integration boundaries, the dashed yellow and blue lines indicate the theoretical and actual peak positions of the Hα profile, and the light blue and red regions represent the integration areas.
Current usage metrics show cumulative count of Article Views (full-text article views including HTML views, PDF and ePub downloads, according to the available data) and Abstracts Views on Vision4Press platform.
Data correspond to usage on the plateform after 2015. The current usage metrics is available 48-96 hours after online publication and is updated daily on week days.
Initial download of the metrics may take a while.