Open Access
Fig. 6
Download original image
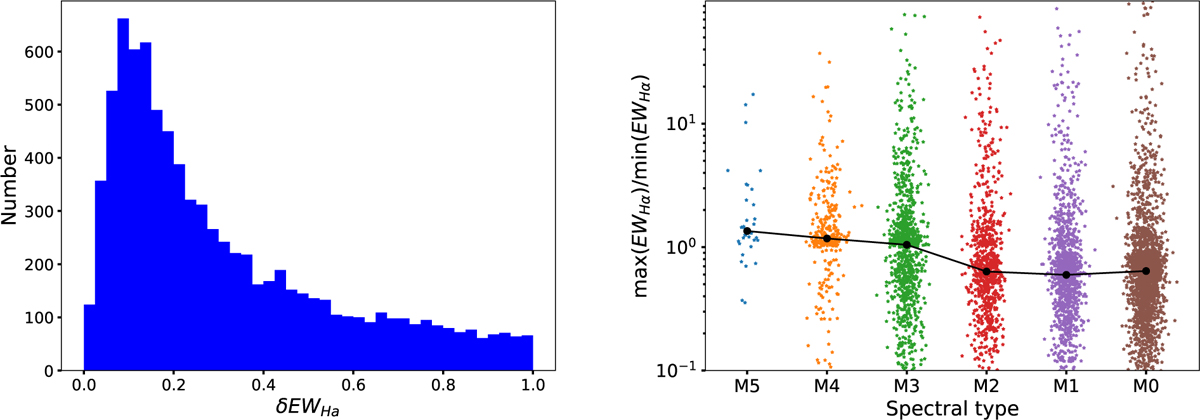
Equivalent width (EW) of the Hα line variation statistics. The left panel shows the distribution statistics of δEWHα (![]() ) for each star. The right panel presents the distribution statistics of REW for each subspectral type, and the black line represents the median REW (REW=EWmax/EWmin) value for each subspectral type.
) for each star. The right panel presents the distribution statistics of REW for each subspectral type, and the black line represents the median REW (REW=EWmax/EWmin) value for each subspectral type.
Current usage metrics show cumulative count of Article Views (full-text article views including HTML views, PDF and ePub downloads, according to the available data) and Abstracts Views on Vision4Press platform.
Data correspond to usage on the plateform after 2015. The current usage metrics is available 48-96 hours after online publication and is updated daily on week days.
Initial download of the metrics may take a while.