Fig. 7
Download original image
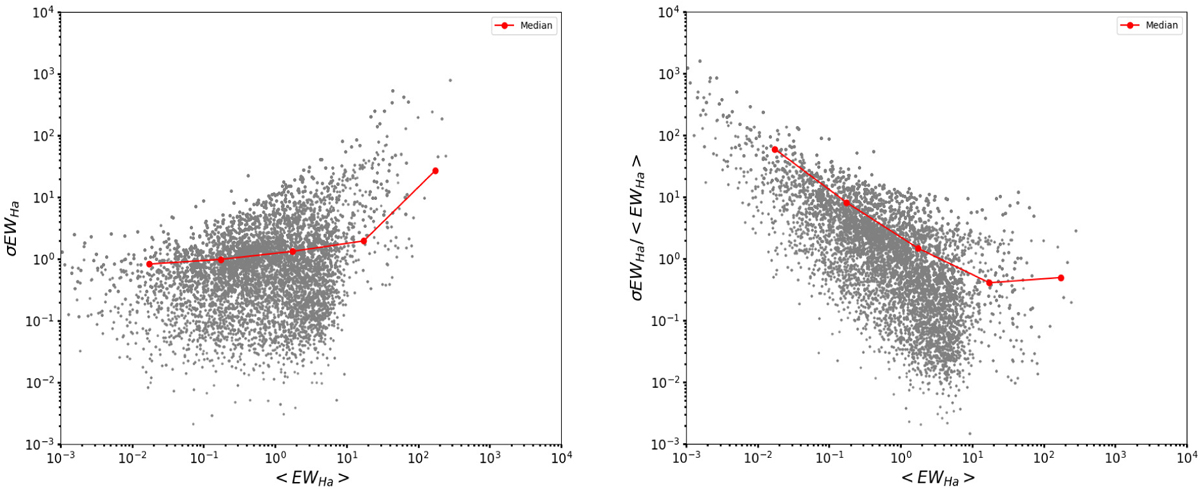
Relation between EWHα, its standard deviation (σ EWHα), and the ratio of the standard deviation to EWHα is as follows (σEWHα/<EWHα>): The left panel illustrates the relation between EWHα and σEWHα, and the right panel shows the relation between EWHα and σEWHα/<EWHα>. The red line represents the median value within each interval.
Current usage metrics show cumulative count of Article Views (full-text article views including HTML views, PDF and ePub downloads, according to the available data) and Abstracts Views on Vision4Press platform.
Data correspond to usage on the plateform after 2015. The current usage metrics is available 48-96 hours after online publication and is updated daily on week days.
Initial download of the metrics may take a while.