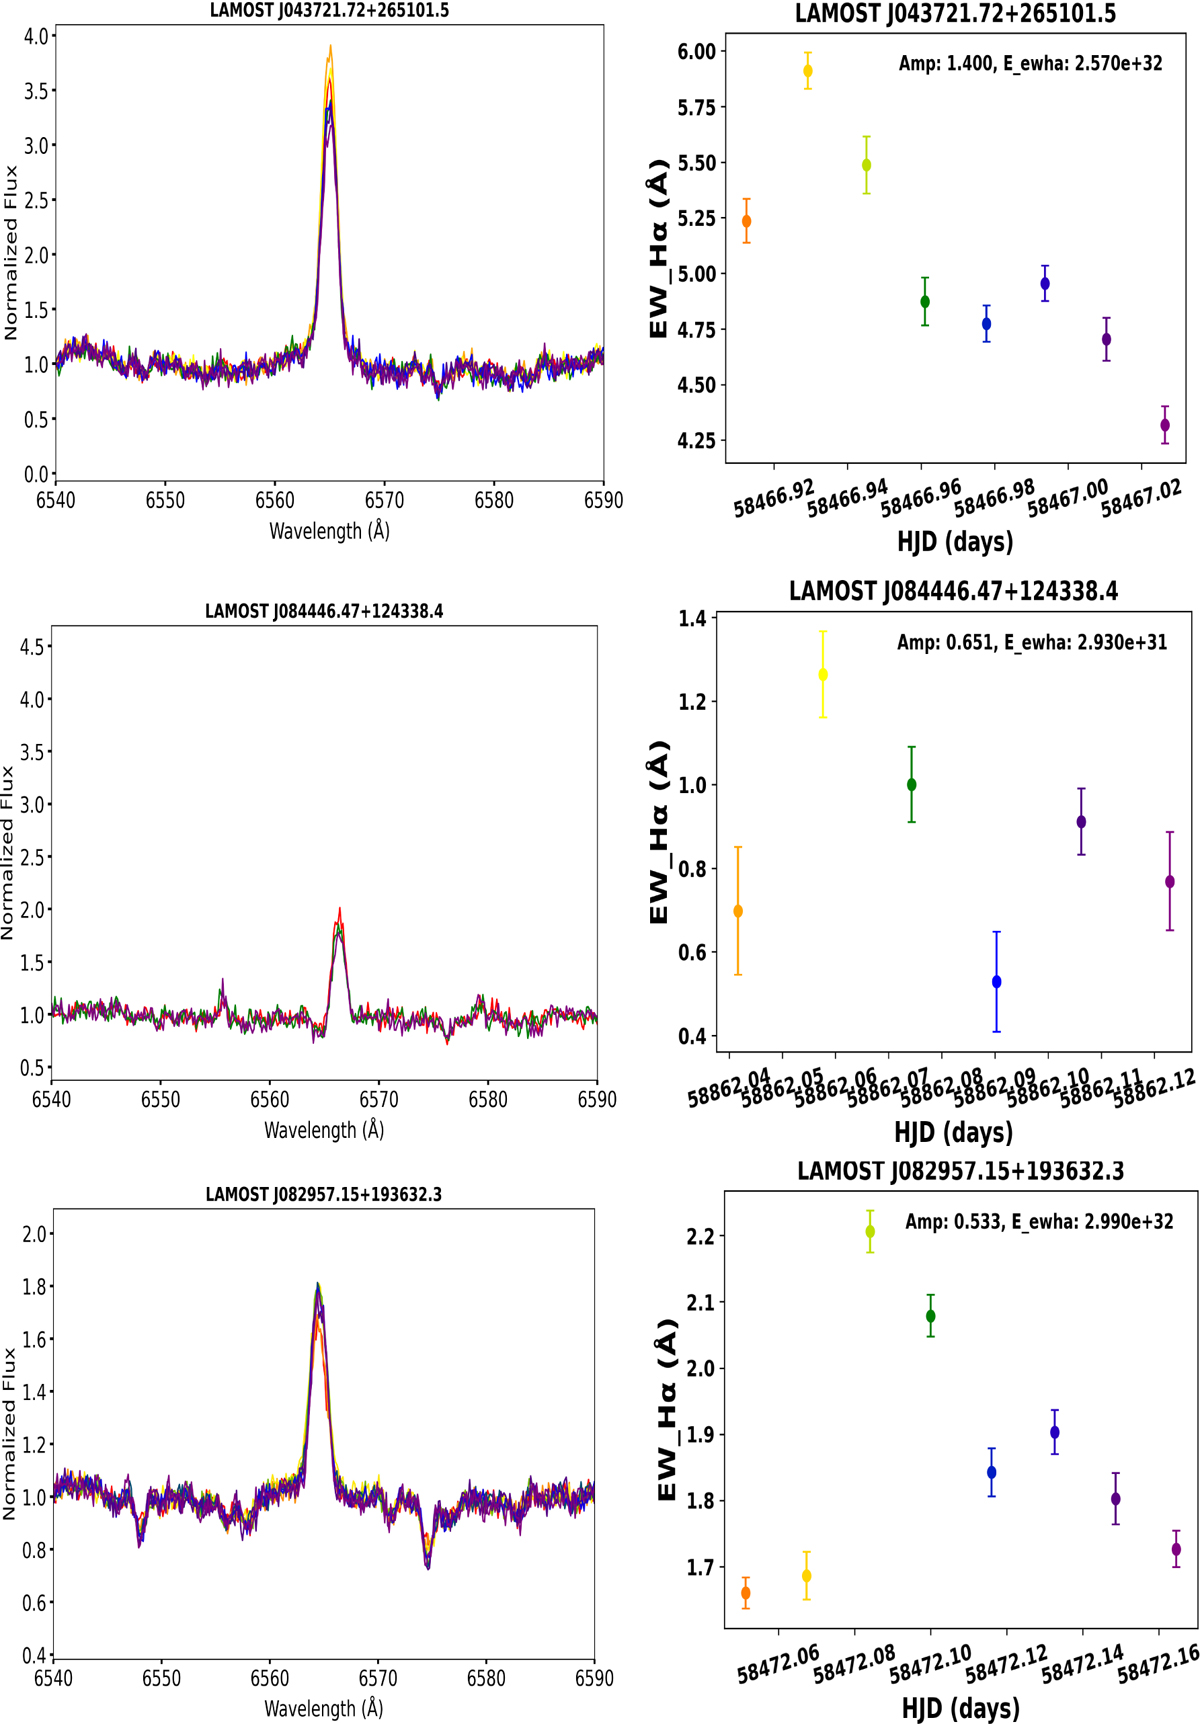
Fig. 8
Download original image
Hα variation in the selected examples. The left panel shows the spectrum that clearly displays the changes in the Hα line. The right panel visually presents the dynamic evolution of EWHα on short timescales, and the vertical red lines indicate the error bars. The colors of the spectral profiles in the left panel correspond to the points in the right panel, which are labeled with their respective heliocentric Julian dates, which allow a clear identification of the observation epochs.
Current usage metrics show cumulative count of Article Views (full-text article views including HTML views, PDF and ePub downloads, according to the available data) and Abstracts Views on Vision4Press platform.
Data correspond to usage on the plateform after 2015. The current usage metrics is available 48-96 hours after online publication and is updated daily on week days.
Initial download of the metrics may take a while.