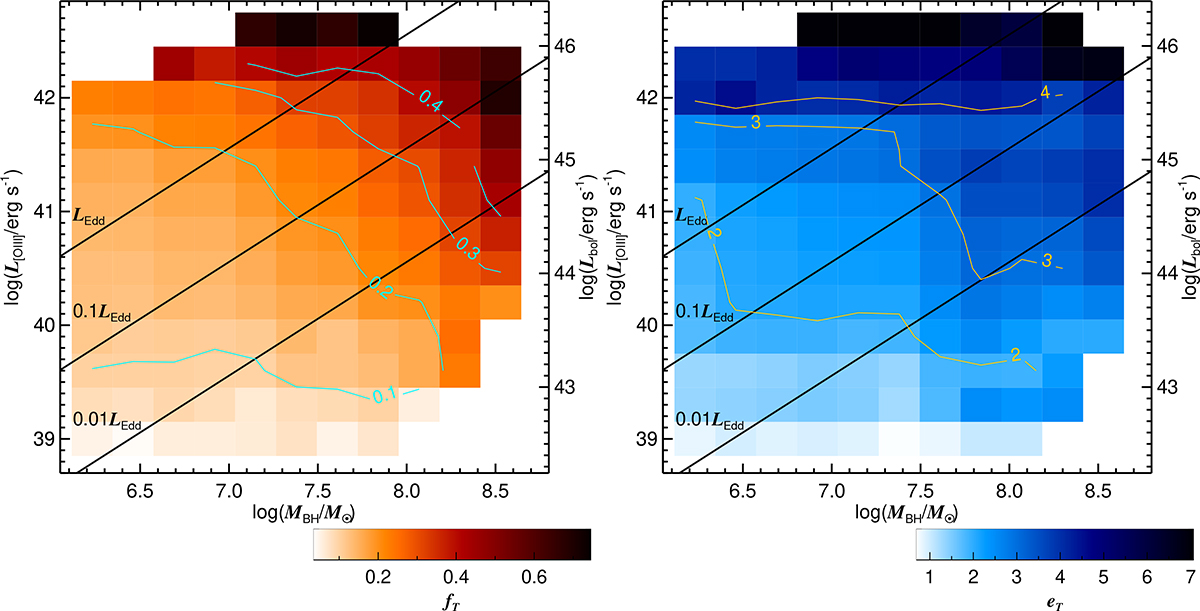
Fig. 10.
Download original image
Fraction of type 1 AGN hosts with tidal features (fT) and its excess (eT), defined as the ratio of fT for AGNs to that of the matched inactive control sample, shown using colors and contours in the log MBH vs. log L[O III] plane (the left panel is for fT, while the right panel is for eT). See the color bars for the color-coded representations of fT and eT. The values in the middle of the contour lines denote fT or eT. To create color maps and contours, we used a grid with block sizes of 0.23 dex and 0.30 dex along the log MBH and log L[O III] axes, respectively. At each grid point, we calculated fT using a rectangular bin with side lengths of 1.38 dex and 1.80 dex along the log MBH and log L[O III] axes, respectively, and computed eT using a rectangular bin with side lengths of 1.84 dex and 2.40 dex. Using a larger bin size than the grid block size to compute the parameters smooths the color maps and contours, revealing the large-scale trends more clearly. We display only the colored bins for which more than 10 and 25 AGNs are used to compute fT and eT, respectively.
Current usage metrics show cumulative count of Article Views (full-text article views including HTML views, PDF and ePub downloads, according to the available data) and Abstracts Views on Vision4Press platform.
Data correspond to usage on the plateform after 2015. The current usage metrics is available 48-96 hours after online publication and is updated daily on week days.
Initial download of the metrics may take a while.