| Issue |
A&A
Volume 704, December 2025
|
|
|---|---|---|
| Article Number | A211 | |
| Number of page(s) | 12 | |
| Section | Extragalactic astronomy | |
| DOI | https://doi.org/10.1051/0004-6361/202555267 | |
| Published online | 10 December 2025 | |
Direct observational evidence that higher-luminosity type 1 active galactic nuclei are most commonly triggered by galaxy mergers
1
Department of Astronomy and Atmospheric Sciences, College of Natural Sciences, Kyungpook National University, Daegu 41566, Republic of Korea
2
School of Liberal Studies, Sejong University, 209 Neungdong-ro, Gwangjin-Gu, Seoul 05006, Republic of Korea
3
Department of Physics and Astronomy, Sejong University, 209 Neungdong-ro, Gwangjin-Gu, Seoul 05006, Republic of Korea
4
Department of Earth Sciences, Pusan National University, Busan 46241, Republic of Korea
5
Korea Astronomy and Space Science Institute (KASI), 776 Daedeokdae-ro, Yuseong-gu, Daejeon 34055, Republic of Korea
★ Corresponding authors: This email address is being protected from spambots. You need JavaScript enabled to view it.
; This email address is being protected from spambots. You need JavaScript enabled to view it.
; This email address is being protected from spambots. You need JavaScript enabled to view it.
.
Received:
23
April
2025
Accepted:
24
October
2025
Abstract
We examine the connection between galaxy mergers and the triggering of active galactic nuclei (AGNs) using a sample of 614 type 1 AGNs at z < 0.07, along with a control sample of inactive galaxies matched to the AGNs for comparison. We used tidal features, detected in deep images from the DESI Legacy Imaging Survey, as direct evidence of recent mergers. We find that the fraction of type 1 AGN hosts with tidal features (fT) is higher for AGNs with higher luminosities and (to a lesser extent) more massive black holes. Specifically, fT rapidly increases from 0.05 ± 0.03 to 0.75 ± 0.13 as the luminosity of the [O III] λ5007 emission line (L[O III]), an indicator for bolometric AGN luminosity, increases in the range 1039.5 ≲ L[O III]/(erg s−1) ≲ 1042.5. In addition, fT increases from 0.13 ± 0.03 to 0.43 ± 0.09 as black hole mass (MBH) increases in the range 106.0 ≲ MBH/M⊙ ≲ 108.5. The fraction fT also increases with the Eddington ratio, although the trend is less significant compared to that with L[O III] and MBH. The excess of fT, defined as the ratio of fT for AGNs to that of their matched inactive counterparts, exhibits similar trends, primarily increasing with L[O III] and weakly with MBH. Our results indicate that, in the local Universe, galaxy mergers are the predominant triggering mechanism for high-luminosity AGNs, whereas they play a lesser role in triggering lower-luminosity AGNs. Additionally, strong events, such as galaxy mergers, may be more necessary to activate massive black holes in more massive galaxies due to their lower gas fractions.
Key words: galaxies: active / galaxies: interactions / quasars: general / quasars: supermassive black holes
© The Authors 2025
 Open Access article, published by EDP Sciences, under the terms of the Creative Commons Attribution License (https://creativecommons.org/licenses/by/4.0), which permits unrestricted use, distribution, and reproduction in any medium, provided the original work is properly cited.
This article is published in open access under the Subscribe to Open model. This email address is being protected from spambots. You need JavaScript enabled to view it. to support open access publication.
1. Introduction
An active galactic nucleus (AGN) is a highly energetic region found at the center of a galaxy. The energy released by AGNs originates from a supermassive black hole (SMBH) surrounded by an accretion disk of gas and dust. As the material falls toward the SMBH, gravitational and frictional processes heat the disk, producing intense radiation, mainly in the ultraviolet to optical wavelength range. This radiation photoionizes gas on multiple spatial scales. The compact, high-density gas close to the SMBH (≲0.1–1 pc; Abuter et al. 2024) constitutes the broad-line region, where high bulk motion velocities broaden permitted lines to widths of several 103 km s−1. On larger scales (hundreds to thousands of parsecs; Schmitt et al. 2003), lower-density ionized gas forms the narrow-line region, which produces permitted and forbidden lines with typical widths of a few times 102 km s−1.
In type 1 AGNs, emission lines from both the broad- and narrow-line regions are visible, whereas in type 2 AGNs only the narrow emission lines are seen. According to the AGN unified model (Antonucci 1993; Urry & Padovani 1995), the difference between type 1 and type 2 arises from the line-of-sight viewing angle of the AGN structures. Additional emission, such as radio waves, can arise from jets launched by interactions between magnetic fields and the spinning SMBH (Blandford & Znajek 1977; Urry & Padovani 1995). Even in the absence of such luminous jets, AGNs can emit radio waves through various mechanisms, such as AGN-driven winds and free-free emission from photoionized gas (Panessa et al. 2019).
Active galactic nuclei are efficient tools for probing several key aspects of the Universe. Some AGNs are extremely luminous, with bolometric luminosities exceeding 1046 erg s−1, allowing them to be detected at redshifts higher than 6 and enabling studies of the early Universe (Kim et al. 2015a, 2019, 2020; Jiang et al. 2016; Wang et al. 2021; Sacchi et al. 2022). Moreover, AGNs are optimum laboratories for examining physics under extreme gravitational and electromagnetic conditions (Dovčiak et al. 2004; Jovanović & Popović 2008; Blandford et al. 2019). In addition, AGNs provide insights into galaxy evolution, as they are expected to play a significant role in regulating star formation and the mass growth of galaxies (Di Matteo et al. 2005; Bower et al. 2006; Croton et al. 2006; Hopkins et al. 2008; Arjona-Gálvez et al. 2024) through powerful winds and jets. This coevolution between AGNs and their host galaxies is reflected in the remarkably tight correlations between SMBH mass and host galaxy properties (Di Matteo et al. 2005; Kormendy & Ho 2013).
Active galactic nuclei can be triggered through various channels. For instance, the supply of cold gas from hot halos of galaxy clusters, as well as ram pressure within clusters, can provide the necessary fuel for AGN activity (Gaspari et al. 2013; Li & Bryan 2014; Tremblay et al. 2016; Poggianti et al. 2017). Secular processes, including the influence of bars and disk instabilities, can also drive gas inflows that ignite AGNs (Shlosman et al. 1989; Crenshaw et al. 2003; Ohta et al. 2007; Hirschmann et al. 2012). In addition, galaxy mergers play an important role, as the induced tidal torques cause gas to lose angular momentum and flow toward the galaxy center, where accretion onto the SMBH can then power AGN activity (Di Matteo et al. 2005; Springel et al. 2005; Hopkins et al. 2008; Capelo et al. 2015).
Previous observational studies have attempted to determine whether galaxy mergers can trigger AGNs. Several studies have shown that AGNs are more likely to be found in interacting or post-merger galaxies compared to inactive galaxies (e.g., there is an excess of the merger fraction, suggesting that mergers can trigger AGN activity (Carpineti et al. 2012; Cotini et al. 2013; Ellison et al. 2013; Hong et al. 2015; Marian et al. 2020; Pierce et al. 2022; Araujo et al. 2023; Hernández-Toledo et al. 2023; Li et al. 2023; Comerford et al. 2024). Some studies have found that dust-obscured high-luminosity AGNs (Kim et al. 2015b, 2023, 2024a,b; Kim & Im 2018) are associated with galaxy mergers (Urrutia et al. 2008; Glikman et al. 2015). However, several studies found no evidence of the connection between mergers and AGNs (Gabor et al. 2009; Cisternas et al. 2011; Kocevski et al. 2012; Sabater et al. 2015; Mechtley et al. 2016; Villforth et al. 2014, 2017; Marian et al. 2019; Shah et al. 2020; Zhao et al. 2022). Furthermore, it has been found that higher-luminosity AGNs are most likely to be triggered by mergers (Treister et al. 2012; Ellison et al. 2013; Urbano-Mayorgas et al. 2019; Pierce et al. 2022, 2023; Hernández-Toledo et al. 2023; Tang et al. 2023; Euclid Collaboration 2025), while other studies did not find such a trend (Villforth et al. 2014; Marian et al. 2020; Steffen et al. 2023; Comerford et al. 2024). Therefore, despite extensive examinations in numerous studies, the connection between galaxy mergers and AGN triggering, as well as its dependence on AGN luminosity, remains a controversial issue that has yet to be fully resolved.
In this study we aim to obtain a more definitive answer by investigating the problem using a large sample of type 1 AGNs and tidal features detected in deep images. While type 2 or other types of AGNs have been thoroughly examined in the previous studies, large samples of type 1 AGNs have not been widely used due to the challenges in sample selection, which requires sophisticated spectral fitting, and due to their bright unobscured AGN emission, which can hinder detailed investigation of the host galaxies. A major strength of using type 1 AGNs lies in their utility for probing essential AGN properties, such as black hole (BH) masses and Eddington ratios. Specifically, probing the Eddington ratio can reveal hidden but important aspects, as it can provide a more balanced perspective on how mergers influence BH activity by identifying low-mass BHs with low AGN luminosities but high Eddington ratios (e.g., Greene & Ho 2007), which are often blended with regularly accreting massive BHs.
Tidal features, which are remnants of stellar debris from galaxy mergers and can be detected through deep images (Quinn 1984; Barnes 1988; Hernquist & Spergel 1992; Feldmann et al. 2008), provide a powerful tool for studying the AGN–merger connection. Because they can persist for several gigayears after a merger, tidal features help overcome the limitation that observations capture only a snapshot of the Universe (Schweizer & Seitzer 1992; Tal et al. 2009; Kaviraj et al. 2011; Sheen et al. 2012, 2016; Duc et al. 2015; Yoon & Lim 2020; Yoon et al. 2022, 2023, 2024a,b; Bílek et al. 2023; Hernández-Toledo et al. 2023). Based on merger signatures detected in deep images from the Dark Energy Spectroscopic Instrument (DESI) Legacy Imaging Survey (Dey et al. 2019), we examined whether galaxy mergers are a significant triggering mechanism of AGNs and, if so, which AGN properties are most closely associated with mergers, using a large sample of 614 type 1 AGNs at z < 0.07. By doing so, we offer a more definitive understanding of the relation between AGNs and galaxy mergers.
In this study, the cosmological parameters are taken to be H0 = 70 km s−1 Mpc−1 for the Hubble constant, ΩΛ = 0.7 for the dark energy density, and Ωm = 0.3 for the matter density. The luminosity of the [O III] λ5007 emission line (or the bolometric AGN luminosity) is expressed in units of erg s−1, and the BH mass in solar masses (M⊙).
2. Sample
The sample of AGNs used in this study is from the catalog of type 1 AGNs from Oh et al. (2015). Oh et al. (2015) cataloged 5553 type 1 AGNs, including low-luminosity AGNs with weak broad-line regions, identified through the analysis of galaxy spectra in the Sloan Digital Sky Survey (SDSS) Data Release (DR) 7. The selection criteria for the type 1 AGNs are as follows: a redshift (z) of < 0.2, a full width at half maximum (FWHM) of broad Hα lines exceeding 800 km s−1, and an amplitude-over-noise ratio1 of broad Hα lines higher than 3, along with additional criteria such as a completeness cut of > 90% derived from simulations using mock spectra.
In this study we used type 1 AGNs at z < 0.07. This redshift cut represents a compromise between ensuring a statistically sufficient number of AGNs in the sample and avoiding higher-redshift AGN hosts, which are more likely to be affected by small angular sizes and the cosmological surface brightness dimming effects (see Eq. (6) in Yoon & Park 2020), making tidal feature detection more challenging. The initial sample includes 640 AGNs at z < 0.07. Of these, 26 AGNs are excluded due to their poor image quality mainly caused by proximity to bright sources (Sect. 3). Thus, the final sample for this study comprises 614 AGNs. We note that our results do not depend on redshift within the range we set (z < 0.07), which we confirmed by dividing the sample into a couple of redshift bins and applying the same analysis, although the statistical significance is reduced due to the smaller sample sizes.
Here, the luminosity of the [O III] λ5007 emission line (L[O III]) is used as an indicator of AGN luminosity, as is commonly adopted in previous studies (Alonso et al. 2007; Oh et al. 2015; Ellison et al. 2013; Comerford et al. 2024).2 We converted L[O III] into the AGN bolometric luminosity (Lbol) by using the correction relation of Lbol ≈ 3500 L[O III] (with a variance of 0.38 dex) from Heckman et al. (2004). As in Oh et al. (2015), we used BH masses (MBH) derived from the single-epoch mass estimation method developed by Greene & Ho (2005), which is based on the line width and luminosity of the broad Hα emission estimated in Oh et al. (2015). The Eddington ratio (λEdd) was defined as Lbol/LEdd, where LEdd is the Eddington luminosity, which is a function of MBH. To illustrate the general properties of the AGNs, Fig. 1 displays the distributions of type 1 AGNs in the redshift versus log MBH plane, with the color of the circles indicating log L[O III] for the AGN sample. In Table 1 we present the properties of type 1 AGNs in our sample, including information on the presence of tidal features in their host galaxies.
Properties of type 1 AGNs.
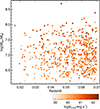 |
Fig. 1. Distributions of type 1 AGNs in the redshift vs. log MBH plane. Type 1 AGNs are indicated by colored circles, with the color representing log L[O III]. See the color bar for the color scale. |
The log L[O III] range of our AGN sample is above ∼39.5, as a consequence of the AGN selection criteria used in the catalog of Oh et al. (2015). Together with other criteria, Oh et al. (2015) selected AGNs based on the signal strength of the broad Hα line and a completeness cut, which is mainly determined by the broad Hα line luminosity. Such criteria can result in a lower limit on L[O III], given its strong correlation with broad Hα line luminosity (Spearman’s rank correlation coefficient = 0.6).
For a quantitative comparison, we defined inactive control sample based on galaxies in SDSS. Previous studies commonly matched control sample based on redshift and mass (Marian et al. 2020; Araujo et al. 2023; Li et al. 2023; Tang et al. 2023; Avirett-Mackenzie et al. 2024; Byrne-Mamahit et al. 2024). According to McAlpine et al. (2020), including additional matching parameters beyond redshift and mass is not likely to be crucial, as the recovered results are not sensitive to the choice of matching criteria. In this study, the inactive galaxies in the control sample are matched to type 1 AGNs based on MBH and redshift. For each AGN, we matched two inactive galaxies that either lack emission lines or exhibit only emission lines classified as star-forming3 according to the criterion of the Baldwin, Phillips, and Terlevich diagram (Baldwin et al. 1981), as defined by Kauffmann et al. (2003) and Brinchmann et al. (2004).
Applying the BH scaling relation between MBH and Mbul presented by Kormendy & Ho (2013),4 the MBH values of inactive galaxies are derived from their bulge stellar masses (Mbul), which are obtained from the Mendel et al. (2014) catalog. This catalog provides bulge, disk, and total stellar mass estimates based on the two-dimensional bulge+disk decompositions5 performed by Simard et al. (2011). AGNs and inactive galaxies are matched within a redshift range of 0.002 and a MBH range of ∼0.1 dex. The number of inactive galaxies in the control sample is 1228.
In Fig. 2 we compare the normalized distributions of redshift (left panel) and log MBH (right panel) for the type 1 AGN sample and their matched inactive control sample. The two samples show nearly identical distributions, as intended through the matching process.
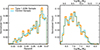 |
Fig. 2. Histograms of the normalized distributions of redshift and log MBH (or equivalently, log Mbul) for the type 1 AGN sample and the matched inactive control sample. |
Osborne & Salim (2024) evaluated the uncertainties and systematic errors in the bulge-to-total light ratios (based on the de Vaucouleurs plus exponential disk model) from Simard et al. (2011) catalog by comparing them with values derived from higher-resolution Hubble Space Telescope images. They reported a standard deviation of 0.2 and a median offset of 0.04 in the bulge-to-total light ratios, which implies that Mbul can be constrained with acceptable accuracy using SDSS images, despite their fundamental limitations. We note that the fraction of inactive galaxies with tidal features marginally increases with Mbul from 0.07 ± 0.01 to 0.10 ± 0.02 across the full 1.5 dex range of Mbul in our sample. Thus, the uncertainties and systematic errors in the estimation of Mbul have little effect on our main results.
3. Detection of tidal features
We used images from the DESI Legacy Survey DR10 (Dey et al. 2019) to detect tidal features. The DESI Legacy Survey comprises three wide-area surveys: the Dark Energy Camera Legacy Survey, the Beijing–Arizona Sky Survey, and the Mayall z-band Legacy Survey. Together, these surveys cover a total area of approximately 14 000 square degrees. The g- and r-band images from the DESI Legacy Survey reach a median surface brightness limit of about 27 mag arcsec−2, as defined by the 1σ background noise within a 1″ × 1″ area. This surface brightness limit is similar to that of the deep co-added r-band images of the Stripe 82 region of SDSS (Yoon & Lim 2020; Yoon et al. 2022, 2023), which are commonly used to identify low surface brightness tidal features around galaxies (e.g., Kaviraj 2010; Schawinski et al. 2010; Hong et al. 2015).
Tidal features are identified through visual inspection of the g- and r-band images6, along with composite color images that combine the g, r, and z bands. During the visual inspection of the images, we individually adjusted pixel value scales (e.g., contrast stretching) and applied Gaussian smoothing with different kernel sizes for all AGN hosts and inactive galaxies in order to enhance faint signals and better identify diffuse tidal features.
Tidal features typically take the form of streams, tails, and multiple shells (Duc et al. 2015; Mancillas et al. 2019; Bílek et al. 2020, 2023; Sola et al. 2022). Tidal streams are thin, elongated features that often appear as fine filaments and are typically linked to minor mergers. In certain cases, these streams are directly connected to smaller companion galaxies. Tidal tails are broad, stretched features that clearly protrude from the host galaxies. These elongated stellar structures, which can form during major mergers, have a similar appearance to tidal streams but are wider and can even extend to the scale of the host galaxies. In some instances, however, tails and streams are not easily distinguishable from one another (Bílek et al. 2020; Sola et al. 2022). Tidal shells have the form of arc-like features with distinct, sharp boundaries. These arcs can either follow a common alignment or be randomly distributed around the host galaxy. Shells located farther from the galaxy tend to be more diffuse. Some galaxies display a combination of different types of tidal features. In this study, tidal tails, streams, and shells, around galaxies are collectively categorized as tidal features7
We find that 109 out of 614 type 1 AGN hosts have tidal features (17.8%). Examples of SDSS color images and deep r-band DESI Legacy Survey images of type 1 AGN hosts with tidal features are shown in the first and second rows of Figs. 3–5, while those of type 1 AGN hosts that do not have tidal features are displayed in the first and second rows of Fig. 6. The third rows of these figures display optical spectra of type 1 AGNs covering the observed wavelength range 4700–7400 Å, in which Hβ, [O III], and Hα emission lines are visible. We also discover that 88 out of 1228 inactive galaxies in the control sample exhibit tidal features (7.2%).
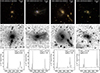 |
Fig. 3. Examples of type 1 AGN hosts with tidal features, which have log(L[O III]/erg s−1) > 41.4. First row: Color images from SDSS. The galaxy ID is provided. The horizontal bar indicates the angular scale of the image. Second row: r-band deep images of the DESI Legacy Imaging Survey. The angular scale of the deep image matches that of the color image in the first row. Third row: Optical spectra of type 1 AGNs covering the observed wavelength range 4700–7400Å, in which Hβ, [O III], and Hα emission lines are visible. Also shown are the values of log L[O III] and log MBH, where L[O III] is in units of erg s−1 and MBH is in units of solar mass (M⊙). |
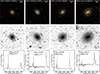 |
Fig. 6. Same as Fig. 3 but for type 1 AGN hosts that do not have tidal features. The AGNs are ordered by decreasing L[O III] from left to right. |
We assessed the reliability of the tidal feature identification by comparing our primary classifications (performed by Y.Y.) with two independent classifications separately conducted by two authors (K.C. and W.B.) on a subsample of 262 type 1 AGNs with log L[O III] > 40.8. The comparison shows that 91% (62/68) and 87% (59/68) of AGN hosts identified as having tidal features by Y.Y. are also classified as having tidal features by K.C. and W.B., respectively. Additionally, 94% (183/194) and 97% (188/194) of AGN hosts without tidal features in Y.Y.’s classification are also identified as having no tidal features by K.C. and W.B., respectively. The outcome of this comparison indicates that the detection of tidal feature is highly consistent across different identifiers, even though it relies on visual inspection, which can be subjective. The high consensus rate over ∼90% for tidal feature identification is also found in our previous studies on the sample of early-type galaxies (Yoon & Lim 2020; Yoon et al. 2022, 2024b). The consensus rate of ∼90%–95% can introduce an additional potential uncertainty of ∼0.01–0.08 to the fraction of tidal features presented in Sect. 4, depending on the number of samples per bin. We note that these uncertainties are smaller than the standard errors defined in this study.
4. Results
We present the properties of our type 1 AGNs and their distributions in Figs. 7 and 8. Figure 7 displays the distribution of type 1 AGNs in the logarithmic values of MBH versus L[O III] (or Lbol) plane, in which AGNs are divided based on the presence or absence of tidal features. Figure 8 shows histograms representing the distributions of log L[O III], log MBH, and log λEdd for AGN hosts with and without tidal features.
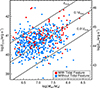 |
Fig. 7. Distribution of type 1 AGNs in the plane of logarithmic values of MBH vs. L[O III] (or Lbol). AGNs are categorized according to the presence or absence of tidal features. The solid black lines indicate constant values of LEdd, 0.1LEdd, and 0.01LEdd. |
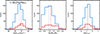 |
Fig. 8. Distributions of log L[O III], log MBH, and log λEdd for AGN hosts with and without tidal features. The vertical dashed lines represent the median value of each parameter for the two AGN categories. The gray vertical lines indicate the full range of each parameter. |
Figure 7 shows that AGN hosts with tidal features are spread across the region in the log MBH versus log L[O III] plane that is populated by AGN hosts without tidal features. However, AGN hosts with tidal features are more likely to lie in the region of higher L[O III] and higher MBH, compared to those without tidal features.
Figure 8 demonstrates that type 1 AGN hosts with tidal features have median L[O III] and MBH values that are 0.28 and 0.22 dex higher, respectively, than those without tidal features. By conducting a Kolmogorov–Smirnov (KS) test on the two distributions of log L[O III] for the two AGN categories, we find that the probability (0 ≤ p ≤ 1) of the null hypothesis, in which the two distributions stem from the same distribution, is p = 3.2 × 10⁻⁵. Similarly, a KS test on the two distributions of log MBH for the two AGN populations yields p = 6.2 × 10⁻⁴. Thus, these tests prove that AGN hosts with and without tidal features have significantly different distributions of L[O III] and MBH. AGN hosts with tidal features have a slightly higher median log λEdd, by 0.08 dex, than those without tidal features, but this difference is not statistically significant, as a KS test on the two distributions of log λEdd for the two AGN categories yields p = 0.16. We reach the same conclusions by deriving p-values from Anderson–Darling tests conducted on the two distributions of log L[O III], log MBH, and log λEdd for the two AGN categories. The tests yield p < 0.001 for log L[O III] and log MBH, while for log λEdd, the p-value is 0.13.
We display the fraction of type 1 AGN hosts with tidal features (fT) as a function of log L[O III], log MBH, and log λEdd in the top panels of Fig. 9. The fraction fT is defined as NT/NAGN, where NAGN denotes the total number of AGN hosts, and NT represents the number of AGN hosts with tidal features8. Figure 9 demonstrates a rapid increase in fT with increasing L[O III], such that fT for the lowest-luminosity AGNs with log L[O III] > 40.0 is 0.05 ± 0.03, while for the highest-luminosity AGNs with log L[O III] > 41.9, it reaches 0.75 ± 0.13. We conducted a hypothesis test to compare the fT values in the two extreme L[O III] bins. The null hypothesis states that there is no difference between the fT values of the highest- and lowest-luminosity AGNs, while the alternative hypothesis is that fT of the highest-luminosity AGNs is significantly higher than that of the low-luminosity AGNs. Using a one-tailed Z-test, we find a p-value of 4.7 × 10⁻⁹. This implies that fT of high-luminosity AGNs is significantly higher than that of low-luminosity AGNs.
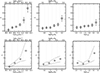 |
Fig. 9. Top panels: fraction of type 1 AGN hosts with tidal features (fT) as a function of log L[O III], log MBH, and log λEdd. The error bar indicates the standard error of the proportion. Bottom panels: excess of fT (eT) as a function of log L[O III], log MBH, and log λEdd, defined as the ratio of fT for AGNs to that of the matched inactive control sample. The dashed lines represent the range of the error value, computed through error propagation from the standard errors of the two proportions. The horizontal lines in the bottom panels represent eT = 1, which indicates that the fT of AGNs is identical to that of the inactive control sample. The gray vertical lines in all the panels mark the boundaries of the bins. The bin sizes in the bottom panels are set to be slightly larger (and hence there is a smaller number of bins) than those in the top panels, in order to reduce the larger uncertainties arising from the error propagation of the two proportion errors. |
Figure 9 also indicates that fT increases with rising MBH, as fT for AGNs with log MBH < 6.5 is 0.13 ± 0.03, while it is 0.43 ± 0.09 for AGNs with log MBH > 7.8. For the fT values in the two extreme MBH bins, we performed a one-tailed hypothesis test, in which the null and the alternative hypotheses are of the same form as those described above. This test yields a p-value of 1.1 × 10⁻⁴, suggesting that fT of AGNs with high MBH is significantly higher than that of AGNs with low MBH.
The third column in the same figure shows that fT also increases with λEdd, though the trend is weaker compared to those with L[O III] and MBH. Specifically, fT for AGNs with log λEdd < −1.7 is 0.13 ± 0.05, while for AGNs with log λEdd > 0.1, it is 0.29 ± 0.09. A one-tailed hypothesis test on the fT values in the two extreme λEdd bins, with the null and the alternative hypotheses following the same structure as those described above, yields a p-value of 0.05. This suggests that the statistical significance of the trend, where fT of AGNs with high λEdd is higher than that of AGNs with low λEdd, is relatively weak.
In the left panel of Fig. 10, we show fT in the log MBH versus log L[O III] plane, in order to illustrate the composite trend of fT with respect to L[O III], MBH, and λEdd9. This figure also demonstrates that fT is higher for AGNs with higher luminosities and more massive BHs, while it peaks at the highest-luminosity AGNs with log L[O III] ≳ 42, showing that the trend is more pronounced with AGN luminosity.
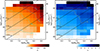 |
Fig. 10. Fraction of type 1 AGN hosts with tidal features (fT) and its excess (eT), defined as the ratio of fT for AGNs to that of the matched inactive control sample, shown using colors and contours in the log MBH vs. log L[O III] plane (the left panel is for fT, while the right panel is for eT). See the color bars for the color-coded representations of fT and eT. The values in the middle of the contour lines denote fT or eT. To create color maps and contours, we used a grid with block sizes of 0.23 dex and 0.30 dex along the log MBH and log L[O III] axes, respectively. At each grid point, we calculated fT using a rectangular bin with side lengths of 1.38 dex and 1.80 dex along the log MBH and log L[O III] axes, respectively, and computed eT using a rectangular bin with side lengths of 1.84 dex and 2.40 dex. Using a larger bin size than the grid block size to compute the parameters smooths the color maps and contours, revealing the large-scale trends more clearly. We display only the colored bins for which more than 10 and 25 AGNs are used to compute fT and eT, respectively. |
Lastly, we present the excess of fT (eT) as a function of log L[O III], log MBH, and log λEdd in the bottom panels of Fig. 9. The parameter eT is defined as the ratio of fT for AGNs in a given bin to that of their matched inactive control galaxies. Figure 9 shows that eT increases from 0.9 ± 0.3 to 6.5 ± 3.4 as L[O III] rises, indicating that fT for low-luminosity AGNs is nearly identical to that of the matched inactive galaxies, whereas high-luminosity AGNs are more than six times as likely to exhibit tidal features as their inactive counterparts. Figure 9 also displays that eT increases from 1.7 ± 0.5 to 3.6 ± 1.0 with rising MBH, although the trend is weaker than that with L[O III]. For λEdd, eT also increases with λEdd. At log λEdd < −0.2, the rate of increase in eT is modest (from ∼2 to 3). However, at very high Eddington ratios of log λEdd > −0.2, eT rises sharply to 5.7 ± 2.6. Based on these results, we find that a certain level of excess in fT exists across all AGNs, except for those with the lowest luminosities.
In the right panel of Fig. 10, eT is shown in the log MBH versus log L[O III] plane, which displays how eT varies jointly with L[O III], MBH, and λEdd. The figure illustrates that eT primarily increases with AGN luminosity, with a weaker trend suggesting that AGNs with more massive BHs also exhibit higher eT. The highest-luminosity AGNs with log L[O III] ≳ 42 exhibit high values of eT ≳ 4 across all MBH, including those with low MBH, which correspond to AGNs with very high λEdd. This explains the sharp increase in eT at very high λEdd shown in Fig. 9.
5. Discussion
5.1. Connection between AGNs and galaxy mergers
Our key result is that fT and eT are higher for more luminous AGNs, with fT and eT reaching 0.75 and ∼6.5, respectively, for the highest-luminosity AGNs with log L[O III] ≳ 42. If fT for AGNs can be interpreted as the fraction of AGNs triggered by mergers, this provides direct observational evidence that galaxy mergers are the predominant triggering mechanism for such high-luminosity AGNs. In addition, the progenitor galaxies involved in mergers that trigger high-luminosity AGNs are likely to be rich in gas (Byrne-Mamahit et al. 2023; Avirett-Mackenzie et al. 2024), as sustaining high-luminosity AGN radiation requires substantial gas accretion onto the BH (Byrne-Mamahit et al. 2023).
The fraction fT of the lowest-luminosity AGNs with log L[O III] ≲ 40 is very low (0.05) and does not significantly differ from that of their inactive counterparts. This suggests that such low-luminosity AGNs are unlikely to be triggered by galaxy mergers; instead, other mechanisms mentioned in Sect. 1 may be responsible for their triggering. For instance, according to Hirschmann et al. (2012), disk instabilities can serve as a trigger mechanism for low- to moderate-luminosity AGNs with log Lbol ≲ 45 (equivalent to log L[O III] ≲ 41.5) in the low-redshift Universe. Given that bar-driven fueling of central SMBHs has been observed in Seyfert galaxies (Crenshaw et al. 2003; Ohta et al. 2007), which host moderate-luminosity AGNs, bars can also trigger low- to moderate-luminosity AGNs with log Lbol ≲ 45. Ram pressure in cluster environments can trigger low-luminosity AGNs, as supported by the sample in Poggianti et al. (2017), in which AGN hosts experiencing ram pressure typically have log L[O III] ≲ 41.
According to Durret et al. (2021), who studied 40 galaxy cluster samples, ∼10% of galaxies in clusters are experiencing ram pressure. This fraction can therefore be considered an upper limit to the population of ram-pressure-triggered AGNs in rich environments such as clusters, under the crude assumption that ram pressure is a highly effective AGN triggering mechanism. We matched our AGN sample to the large redshift-survey group catalog of Tempel et al. (2014), which is constructed from SDSS DR10. Among the 538 matched AGNs, we find that 58% of AGNs reside in group or cluster environments, while 13% are located in richer environments with ≥10 spectroscopic members, a typical threshold in observational work used to distinguish environments denser than poor clusters or rich groups (Miller et al. 2005; Porter & Raychaudhury 2005). Combining these figures, we estimate that roughly ≲1–5% of our AGN sample may be undergoing ram pressure. Future studies of AGN environments using large survey data will provide a more reliable estimate of the fraction of ram-pressure-triggered AGNs.
The other AGNs, except those in the highest- and lowest-luminosity bins, do not exhibit fT higher than 0.4 but show the excess in fT compared to their inactive counterparts. This implies that galaxy mergers contribute to triggering of these AGNs, although mergers are not the dominant triggering mechanism. Low- to moderate luminosity AGN populations are far more numerous than high-luminosity AGNs, which are primarily triggered by mergers. Therefore, it can be said that most AGNs are generally triggered by mechanisms other than galaxy mergers, as suggested by several studies (Treister et al. 2012; Steinborn et al. 2018; Man et al. 2019; McAlpine et al. 2020; Hernández-Toledo et al. 2023).
Since more massive galaxies tend to host more massive SMBH (Kormendy & Ho 2013), our finding that fT is higher for AGNs with higher MBH is consistent with the previous studies showing that more massive galaxies are more likely to exhibit tidal features, suggesting a higher likelihood of recent mergers in more massive galaxies (Hong et al. 2015; Yoon & Lim 2020; Yoon et al. 2024a). However, the rate of increase in fT with MBH is higher for AGNs than for their inactive counterparts, as eT is higher at higher MBH. Although this trend is not very strong, it implies that galaxy mergers play a more crucial role in activating more massive SMBHs, as shown in the simulation by Hopkins et al. (2014). This trend may be related to the fact that lower-mass galaxies have a higher gas fraction (Hopkins et al. 2009; Masters et al. 2012). In this case, due to the abundant gas in lower-mass galaxies, mild mechanisms, other than mergers, can sufficiently induce gas inflow onto their SMBHs. In contrast, a stronger event, such as galaxy mergers, is more necessary to activate massive SMBHs in more massive galaxies due to their lower gas fraction, leading to increased eT with increasing MBH.
According to Pierce et al. (2023), the surface brightness depth of images is an important factor in studying merger features. Thus, our results may be affected by image depth. For example, a lot of very faint tidal features, which are only detectable through far deeper images, may be hidden around low-luminosity AGN hosts, meaning that the actual fT for those AGNs could be much higher. Even if that is the case, we can still conclude that tidal features prominent enough to be detected in this study are more frequently found around AGNs with higher luminosities and more massive MBH, which means that these AGNs are more likely associated with more significant or recent mergers than their low-luminosity or less massive counterparts. Moreover, the excess eT is unlikely to be significantly influenced by image depth, as demonstrated by Ellison et al. (2019).
5.2. Near- and super-Eddington AGNs and the uncertainties in Eddington ratios
In our AGN sample, 5% have λEdd higher than 1. The large uncertainty associated with observed Eddington ratios may result in AGNs with intrinsically high Eddington ratios being identified as near- or super-Eddington AGNs. This uncertainty arises from several factors. Specifically, the conversion from L[O III] to Lbol may involve an uncertainty larger than ∼0.4 dex (Heckman et al. 2004). Additionally, BH mass measurements based on single-epoch spectra are known to have uncertainties of a factor of 3 (Greene & Ho 2005). Combined, these factors can result in uncertainties of ∼0.7 dex in the Eddington ratios calculated in this study.
Another source of uncertainty that can lead to high observed Eddington ratios is the presence of narrow-line Seyfert 1 galaxies, whose broad emission lines have FWHMs of less than ∼2000 km s−1. According to Marconi et al. (2008), MBH values for this type of AGN can be underestimated by more than ∼0.5 dex, potentially contributing to the apparent excess of super-Eddington AGNs. However, excluding AGNs with FWHMs of broad Hα lines below 2000 km s−1 (which account for 9% of our AGN sample) does not change our results, suggesting that the bias introduced by this effect is negligible.
However, it is also possible that some of the observed super-Eddington AGNs are genuinely accreting at such high rates. The structure of real AGNs often deviates significantly from the assumption of spherical symmetry used in calculating Eddington ratios, allowing for super-Eddington accretion to be physically possible in certain cases (Du et al. 2015). Taken together, while measurement uncertainties and potential narrow-line Seyfert 1 galaxies can inflate Eddington ratios, departures from spherical symmetry suggest that some objects are genuinely near- or super-Eddington. Accordingly, the Eddington ratios presented here should be interpreted with caution.
5.3. Comparison with previous studies
As mentioned earlier in Sect. 1, the excess of the merger fraction in AGN hosts is a controversial issue, but we find the direct evidence of a strong AGN–merger connection, particularly for very luminous AGNs. This demonstrates the importance of including AGNs with a wide range of luminosities in the sample to develop a comprehensive understanding of the AGN–merger connection. Redshift ranges of AGN samples can also be an important factor contributing to the different results, as most studies that found no evidence of a connection between mergers and AGNs use samples at higher redshifts (0.5 ≲ z ≲ 3.0; Gabor et al. 2009; Cisternas et al. 2011; Kocevski et al. 2012; Mechtley et al. 2016; Villforth et al. 2014, 2017; Marian et al. 2019; Shah et al. 2020), while those suggesting the AGN–merger connection, including this study, typically focus on lower redshifts (z ≲ 0.2; Carpineti et al. 2012; Cotini et al. 2013; Ellison et al. 2013; Hong et al. 2015; Marian et al. 2020; Araujo et al. 2023; Hernández-Toledo et al. 2023; Li et al. 2023; Comerford et al. 2024). The difference in results due to the redshift range of the sample may stem from the fact that mergers play an increasingly important role in triggering AGNs as the Universe evolves, even though the abundance of merging systems decreases with decreasing redshift (McAlpine et al. 2020). In addition, the difficulty in detecting merger or disturbance features in high-redshift galaxies, due to cosmological surface brightness dimming and small angular sizes, may have influenced studies of high-redshift AGNs, as cosmological dimming has been identified as one of the most important factors affecting the study of merger features, according to Pierce et al. (2023).
Comparing our results with previous studies supporting the AGN–merger connection allows us to broaden our understanding of the general AGN population, as our analysis here is limited to type 1 AGNs selected through spectroscopy. Using type 2 AGNs with 40.5 ≲ log L[O III] ≲ 42.5, which overlaps with the luminosity range of our sample, Pierce et al. (2022) and Pierce et al. (2023) show that type 2 AGN hosts exhibit a substantially enhanced rate of morphological disturbance, by a factor of ∼2–3, compared with a matched control sample. Furthermore, the disturbance rate increases from 30% to 70% across the full luminosity range, accompanied by an increase in the enhancement factor relative to the control sample from 1 to 3. These findings are highly consistent with our results. Urbano-Mayorgas et al. (2019) suggest that low-luminosity type 2 AGNs with log L[O III] ≲ 41.9 exhibit a low fraction of disturbed morphology (6%) compared to high-luminosity type 2 AGNs with log L[O III] ≳ 41.9, which show a fraction of 34%. In addition, several previous studies support the AGN–merger connection for type 2 AGNs (Carpineti et al. 2012; Araujo et al. 2023; Li et al. 2023).
Several studies based on type 1 AGNs report results consistent with ours. For instance, Urrutia et al. (2008) found that over ∼80% of intrinsically bright type 1 AGNs exhibit strong evidence of recent or ongoing mergers, based on dust-reddened quasars. Tang et al. (2023) reported a correlation between Lbol and host asymmetry in type 1 AGNs, which strengthens significantly at the highest luminosities of log Lbol > 45. Similarly, Hernández-Toledo et al. (2023) found that both type 1 and type 2 AGNs show a higher incidence of tidal features than a non-AGN control sample. Given that the difference between type 1 and type 2 AGNs arises from the viewing angle, according to the AGN unified model, it is reasonable that the AGN–merger connection and its luminosity-dependent trend are similarly observed in both types.
Multiple previous studies based on AGNs selected via X-ray or infrared observations are also consistent with our results, supporting the AGN–merger connection. For example, using an AGN sample selected from X-ray, infrared, and spectroscopic surveys, Treister et al. (2012) find a strong correlation between AGN luminosity and the fraction of host galaxies undergoing mergers. Specifically, the fraction increases from ∼4% at log Lbol ∼ 43 to ∼80% at log Lbol ∼ 46, which is very similar to our result. Other studies also support the AGN–merger connection based on AGNs selected via X-ray or infrared (e.g., Cotini et al. 2013; Li et al. 2023). Thus, these results, combined with ours, imply that the AGN–merger connection, particularly for high-luminosity AGNs, can be identified across AGN samples selected through various wavelength windows.
6. Summary
Using a large sample of 614 type 1 AGNs at z < 0.07, we explored whether galaxy mergers are a significant triggering mechanism for AGNs and identified the AGN properties most associated with mergers, aiming to gain a clearer understanding of the AGN–galaxy merger connection. For the quantitative comparison, we used a control sample of inactive galaxies that are matched to AGNs by MBH and redshift. We identified tidal features, which are direct evidence of recent mergers, through visual inspection of DESI Legacy Survey images with a surface brightness depth of ∼27 mag arcsec−2, a level that previous studies have shown to be sufficient for the detection of tidal features (Kaviraj 2010; Schawinski et al. 2010; Hong et al. 2015). We focused on two parameters: the fraction of type 1 AGN hosts with tidal features (fT) and its excess (eT), which is defined as the ratio of fT for AGNs to that of the matched inactive control sample.
We discover that fT is higher for AGNs with higher luminosities and (to a lesser extent) more massive BHs. Specifically, fT rapidly increases from 0.05 ± 0.03 to 0.75 ± 0.13 as L[O III] rises in the range 1039.5 ≲ L[O III]/(erg s−1) ≲ 1042.5, while fT increases from 0.13 ± 0.03 to 0.43 ± 0.09 as MBH increases in the range 106.0 ≲ MBH/M⊙ ≲ 108.5. The fraction fT also increases with λEdd, though the trend is less significant compared to those with L[O III] and MBH.
We also find that eT primarily increases with AGN luminosity, with a weaker trend indicating that eT is higher for AGNs with more massive BHs. Specifically, eT increases from 0.9 ± 0.3 to 6.5 ± 3.4 as L[O III] rises, where as eT increases from 1.7 ± 0.5 to 3.6 ± 1.0 with increasing MBH.
Our findings offer direct observational evidence that, in the local Universe, galaxy mergers are the predominant triggering mechanism for high-luminosity AGNs, whereas they play a lesser role in the triggering of lower-luminosity AGNs. In addition, our result suggest that a strong event, such as galaxy mergers, is more necessary to activate massive SMBHs in more massive galaxies because of their lower gas fractions.
With deeper images from future large surveys, we will classify tidal features into several types and explore how different types of mergers relate to AGN properties, as each tidal feature type reflects mergers with distinct natures and origins (Yoon et al. 2024b).
Data availability
Full Table 1 is available at the CDS via https://cdsarc.cds.unistra.fr/viz-bin/cat/J/A+A/704/A211
Acknowledgments
This research was supported by Kyungpook National University Research Fund, 2025. This research was supported by the National Research Foundation of Korea (NRF) grant funded by the Korea government (MSIT) (RS-2025-16064514). Y. K. was supported by the faculty research fund of Sejong University in 2025 and the National Research Foundation of Korea (NRF) grant funded by the Korean government (MSIT) (No. 2021R1C1C2091550). D.K. acknowledges the support by the National Research Foundation of Korea (NRF) grant (No. 2021R1C1C1013580) funded by the Korean government (MSIT). W.B. was supported by the Korea Astronomy and Space Science Institute under the R&D program (Project No. 2025-1-831-00) supervised by the Ministry of Science and ICT.
References
- Abuter, R., Allouche, F., Amorim, A., et al. 2024, Nature, 627, 281 [NASA ADS] [CrossRef] [Google Scholar]
- Alonso, M. S., Lambas, D. G., Tissera, P., et al. 2007, MNRAS, 375, 1017 [NASA ADS] [CrossRef] [Google Scholar]
- Antonucci, R. 1993, ARA&A, 31, 473 [Google Scholar]
- Araujo, B. L. C., Storchi-Bergmann, T., Rembold, S. B., et al. 2023, MNRAS, 522, 5165 [NASA ADS] [CrossRef] [Google Scholar]
- Arjona-Gálvez, E., Di Cintio, A., & Grand, R. J. J. 2024, A&A, 690, A286 [NASA ADS] [CrossRef] [EDP Sciences] [Google Scholar]
- Avirett-Mackenzie, M. S., Villforth, C., Huertas-Company, M., et al. 2024, MNRAS, 528, 6915 [Google Scholar]
- Baldwin, J. A., Phillips, M. M., & Terlevich, R. 1981, PASP, 93, 5 [Google Scholar]
- Barnes, J. E. 1988, ApJ, 331, 699 [NASA ADS] [CrossRef] [Google Scholar]
- Bílek, M., Duc, P.-A., Cuillandre, J.-C., et al. 2020, MNRAS, 498, 2138 [Google Scholar]
- Bílek, M., Duc, P.-A., & Sola, E. 2023, A&A, 672, A27 [NASA ADS] [CrossRef] [EDP Sciences] [Google Scholar]
- Blandford, R., Meier, D., & Readhead, A. 2019, ARA&A, 57, 467 [NASA ADS] [CrossRef] [Google Scholar]
- Blandford, R. D., & Znajek, R. L. 1977, MNRAS, 179, 433 [NASA ADS] [CrossRef] [Google Scholar]
- Bower, R. G., Benson, A. J., Malbon, R., et al. 2006, MNRAS, 370, 645 [Google Scholar]
- Brinchmann, J., Charlot, S., White, S. D. M., et al. 2004, MNRAS, 351, 1151 [Google Scholar]
- Byrne-Mamahit, S., Hani, M. H., Ellison, S. L., et al. 2023, MNRAS, 519, 4966 [NASA ADS] [CrossRef] [Google Scholar]
- Byrne-Mamahit, S., Patton, D. R., Ellison, S. L., et al. 2024, MNRAS, 528, 5864 [Google Scholar]
- Capelo, P. R., Volonteri, M., Dotti, M., et al. 2015, MNRAS, 447, 2123 [NASA ADS] [CrossRef] [Google Scholar]
- Carpineti, A., Kaviraj, S., Darg, D., et al. 2012, MNRAS, 420, 2139 [Google Scholar]
- Choi, Y.-Y., Han, D.-H., & Kim, S. S. 2010, J. Korean Astron. Soc., 43, 191 [NASA ADS] [CrossRef] [Google Scholar]
- Cisternas, M., Jahnke, K., Inskip, K. J., et al. 2011, ApJ, 726, 57 [NASA ADS] [CrossRef] [Google Scholar]
- Comerford, J. M., Nevin, R., Negus, J., et al. 2024, ApJ, 963, 53 [NASA ADS] [CrossRef] [Google Scholar]
- Cotini, S., Ripamonti, E., Caccianiga, A., et al. 2013, MNRAS, 431, 2661 [NASA ADS] [CrossRef] [Google Scholar]
- Crenshaw, D. M., Kraemer, S. B., & Gabel, J. R. 2003, AJ, 126, 1690 [NASA ADS] [CrossRef] [Google Scholar]
- Croton, D. J., Springel, V., White, S. D. M., et al. 2006, MNRAS, 365, 11 [Google Scholar]
- Dey, A., Schlegel, D. J., Lang, D., et al. 2019, AJ, 157, 168 [Google Scholar]
- Di Matteo, T., Springel, V., & Hernquist, L. 2005, Nature, 433, 604 [NASA ADS] [CrossRef] [Google Scholar]
- Dovčiak, M., Karas, V., & Matt, G. 2004, MNRAS, 355, 1005 [CrossRef] [Google Scholar]
- Du, P., Hu, C., Lu, K.-X., et al. 2015, ApJ, 806, 22 [NASA ADS] [CrossRef] [Google Scholar]
- Duc, P.-A., Cuillandre, J.-C., Karabal, E., et al. 2015, MNRAS, 446, 120 [Google Scholar]
- Durret, F., Chiche, S., Lobo, C., et al. 2021, A&A, 648, A63 [NASA ADS] [CrossRef] [EDP Sciences] [Google Scholar]
- Ellison, S. L., Mendel, J. T., Patton, D. R., et al. 2013, MNRAS, 435, 3627 [CrossRef] [Google Scholar]
- Ellison, S. L., Viswanathan, A., Patton, D. R., et al. 2019, MNRAS, 487, 2491 [NASA ADS] [CrossRef] [Google Scholar]
- Euclid Collaboration (La Marca, A., et al.) 2025, A&A, in press https://doi.org/10.1051/0004-6361/202554579 [Google Scholar]
- Feldmann, R., Mayer, L., & Carollo, C. M. 2008, ApJ, 684, 1062 [NASA ADS] [CrossRef] [Google Scholar]
- Gabor, J. M., Impey, C. D., Jahnke, K., et al. 2009, ApJ, 691, 705 [NASA ADS] [CrossRef] [Google Scholar]
- Gaspari, M., Ruszkowski, M., & Oh, S. P. 2013, MNRAS, 432, 3401 [NASA ADS] [CrossRef] [Google Scholar]
- Glikman, E., Simmons, B., Mailly, M., et al. 2015, ApJ, 806, 218 [Google Scholar]
- Greene, J. E., & Ho, L. C. 2005, ApJ, 630, 122 [NASA ADS] [CrossRef] [Google Scholar]
- Greene, J. E., & Ho, L. C. 2007, ApJ, 670, 92 [NASA ADS] [CrossRef] [Google Scholar]
- Heckman, T. M., Kauffmann, G., Brinchmann, J., et al. 2004, ApJ, 613, 109 [Google Scholar]
- Hernández-Toledo, H. M., Cortes-Suárez, E., Vázquez-Mata, J. A., et al. 2023, MNRAS, 523, 4164 [CrossRef] [Google Scholar]
- Hernquist, L., & Spergel, D. N. 1992, ApJ, 399, L117 [NASA ADS] [CrossRef] [Google Scholar]
- Hirschmann, M., Somerville, R. S., Naab, T., et al. 2012, MNRAS, 426, 237 [NASA ADS] [CrossRef] [Google Scholar]
- Hong, J., Im, M., Kim, M., et al. 2015, ApJ, 804, 34 [Google Scholar]
- Hopkins, P. F., Hernquist, L., Cox, T. J., et al. 2008, ApJS, 175, 356 [NASA ADS] [CrossRef] [Google Scholar]
- Hopkins, P. F., Kocevski, D. D., & Bundy, K. 2014, MNRAS, 445, 823 [NASA ADS] [CrossRef] [Google Scholar]
- Hopkins, P. F., Somerville, R. S., Cox, T. J., et al. 2009, MNRAS, 397, 802 [NASA ADS] [CrossRef] [Google Scholar]
- Jiang, L., McGreer, I. D., Fan, X., et al. 2016, ApJ, 833, 222 [Google Scholar]
- Jovanović, P., & Popović, L. Č. 2008, Fortschritte der Physik, 56, 456 [Google Scholar]
- Kauffmann, G., Heckman, T. M., Tremonti, C., et al. 2003, MNRAS, 346, 1055 [Google Scholar]
- Kaviraj, S. 2010, MNRAS, 406, 382 [NASA ADS] [CrossRef] [Google Scholar]
- Kaviraj, S., Tan, K.-M., Ellis, R. S., et al. 2011, MNRAS, 411, 2148 [NASA ADS] [CrossRef] [Google Scholar]
- Kim, D., & Im, M. 2018, A&A, 610, A31 [EDP Sciences] [Google Scholar]
- Kim, D., Im, M., Glikman, E., et al. 2015b, ApJ, 812, 66 [NASA ADS] [CrossRef] [Google Scholar]
- Kim, Y., Im, M., Jeon, Y., et al. 2015a, ApJ, 813, L35 [NASA ADS] [CrossRef] [Google Scholar]
- Kim, Y., Im, M., Jeon, Y., et al. 2019, ApJ, 870, 86 [NASA ADS] [CrossRef] [Google Scholar]
- Kim, Y., Im, M., Jeon, Y., et al. 2020, ApJ, 904, 111 [NASA ADS] [CrossRef] [Google Scholar]
- Kim, D., Im, M., Kim, M., et al. 2023, ApJ, 954, 156 [NASA ADS] [CrossRef] [Google Scholar]
- Kim, D., Im, M., Lim, G., et al. 2024a, J. Korean Astron. Soc., 57, 95 [Google Scholar]
- Kim, D., Kim, Y., Im, M., et al. 2024b, A&A, 690, A283 [NASA ADS] [CrossRef] [EDP Sciences] [Google Scholar]
- Kocevski, D. D., Faber, S. M., Mozena, M., et al. 2012, ApJ, 744, 148 [NASA ADS] [CrossRef] [Google Scholar]
- Kormendy, J., & Ho, L. C. 2013, ARA&A, 51, 511 [Google Scholar]
- Li, Y., & Bryan, G. L. 2014, ApJ, 789, 153 [Google Scholar]
- Li, W., Nair, P., Irwin, J., et al. 2023, ApJ, 944, 168 [NASA ADS] [CrossRef] [Google Scholar]
- Man, Z., Peng, Y., Kong, X., et al. 2019, MNRAS, 488, 89 [Google Scholar]
- Mancillas, B., Duc, P.-A., Combes, F., et al. 2019, A&A, 632, A122 [NASA ADS] [CrossRef] [EDP Sciences] [Google Scholar]
- Marconi, A., Axon, D. J., Maiolino, R., et al. 2008, ApJ, 678(2), 693 [NASA ADS] [CrossRef] [Google Scholar]
- Marian, V., Jahnke, K., Mechtley, M., et al. 2019, ApJ, 882, 141 [CrossRef] [Google Scholar]
- Marian, V., Jahnke, K., Andika, I., et al. 2020, ApJ, 904, 79 [NASA ADS] [CrossRef] [Google Scholar]
- Masters, K. L., Nichol, R. C., Haynes, M. P., et al. 2012, MNRAS, 424, 2180 [Google Scholar]
- McAlpine, S., Harrison, C. M., Rosario, D. J., et al. 2020, MNRAS, 494, 5713 [NASA ADS] [CrossRef] [Google Scholar]
- Mechtley, M., Jahnke, K., Windhorst, R. A., et al. 2016, ApJ, 830, 156 [NASA ADS] [CrossRef] [Google Scholar]
- Mendel, J. T., Simard, L., Palmer, M., et al. 2014, ApJS, 210, 3 [Google Scholar]
- Miller, C. J., Nichol, R. C., Reichart, D., et al. 2005, AJ, 130, 968 [Google Scholar]
- Oh, K., Yi, S. K., Schawinski, K., et al. 2015, ApJS, 219, 1 [Google Scholar]
- Ohta, K., Aoki, K., Kawaguchi, T., et al. 2007, ApJS, 169, 1 [NASA ADS] [CrossRef] [Google Scholar]
- Osborne, C., & Salim, S. 2024, ApJ, 965, 161 [Google Scholar]
- Panessa, F., Baldi, R. D., Laor, A., et al. 2019, Nat. Astron., 3, 387 [Google Scholar]
- Pierce, J. C. S., Tadhunter, C. N., Gordon, Y., et al. 2022, MNRAS, 510, 1163 [Google Scholar]
- Pierce, J. C. S., Tadhunter, C., Ramos Almeida, C., et al. 2023, MNRAS, 522, 1736 [NASA ADS] [CrossRef] [Google Scholar]
- Poggianti, B. M., Jaffé, Y. L., Moretti, A., et al. 2017, Nature, 548, 304 [Google Scholar]
- Porter, S. C., & Raychaudhury, S. 2005, MNRAS, 364, 1387 [Google Scholar]
- Quinn, P. J. 1984, ApJ, 279, 596 [Google Scholar]
- Sabater, J., Best, P. N., & Heckman, T. M. 2015, MNRAS, 447, 110 [NASA ADS] [CrossRef] [Google Scholar]
- Sacchi, A., Risaliti, G., Signorini, M., et al. 2022, A&A, 663, L7 [NASA ADS] [CrossRef] [EDP Sciences] [Google Scholar]
- Schawinski, K., Dowlin, N., Thomas, D., et al. 2010, ApJ, 714, L108 [NASA ADS] [Google Scholar]
- Schmitt, H. R., Donley, J. L., Antonucci, R. R. J., et al. 2003, ApJ, 597, 768 [NASA ADS] [CrossRef] [Google Scholar]
- Schweizer, F., & Seitzer, P. 1992, AJ, 104, 1039 [Google Scholar]
- Shah, E. A., Kartaltepe, J. S., Magagnoli, C. T., et al. 2020, ApJ, 904, 107 [NASA ADS] [CrossRef] [Google Scholar]
- Sheen, Y.-K., Yi, S. K., Ree, C. H., et al. 2012, ApJS, 202, 8 [Google Scholar]
- Sheen, Y.-K., Yi, S. K., Ree, C. H., et al. 2016, ApJ, 827, 32 [NASA ADS] [CrossRef] [Google Scholar]
- Shlosman, I., Frank, J., & Begelman, M. C. 1989, Nature, 338, 45 [Google Scholar]
- Simard, L., Mendel, J. T., Patton, D. R., et al. 2011, ApJS, 196, 11 [CrossRef] [Google Scholar]
- Sola, E., Duc, P.-A., Richards, F., et al. 2022, A&A, 662, A124 [NASA ADS] [CrossRef] [EDP Sciences] [Google Scholar]
- Springel, V., Di Matteo, T., & Hernquist, L. 2005, MNRAS, 361, 776 [Google Scholar]
- Steffen, J. L., Fu, H., Brownstein, J. R., et al. 2023, ApJ, 942, 107 [NASA ADS] [CrossRef] [Google Scholar]
- Steinborn, L. K., Hirschmann, M., Dolag, K., et al. 2018, MNRAS, 481, 341 [NASA ADS] [CrossRef] [Google Scholar]
- Tal, T., van Dokkum, P. G., Nelan, J., et al. 2009, AJ, 138, 1417 [NASA ADS] [CrossRef] [Google Scholar]
- Tang, S., Silverman, J. D., Yesuf, H. M., et al. 2023, MNRAS, 521, 5272 [CrossRef] [Google Scholar]
- Tempel, E., Tamm, A., Gramann, M., et al. 2014, A&A, 566, A1 [NASA ADS] [CrossRef] [EDP Sciences] [Google Scholar]
- Treister, E., Schawinski, K., Urry, C. M., et al. 2012, ApJ, 758, L39 [NASA ADS] [CrossRef] [Google Scholar]
- Tremblay, G. R., Oonk, J. B. R., Combes, F., et al. 2016, Nature, 534, 218 [NASA ADS] [CrossRef] [Google Scholar]
- Urbano-Mayorgas, J. J., Villar Martín, M., Buitrago, F., et al. 2019, MNRAS, 483, 1829 [Google Scholar]
- Urrutia, T., Lacy, M., & Becker, R. H. 2008, ApJ, 674, 80 [Google Scholar]
- Urry, C. M., & Padovani, P. 1995, PASP, 107, 803 [NASA ADS] [CrossRef] [Google Scholar]
- Villforth, C., Hamann, F., Rosario, D. J., et al. 2014, MNRAS, 439, 3342 [NASA ADS] [CrossRef] [Google Scholar]
- Villforth, C., Hamilton, T., Pawlik, M. M., et al. 2017, MNRAS, 466, 812 [NASA ADS] [CrossRef] [Google Scholar]
- Wang, F., Yang, J., Fan, X., et al. 2021, ApJ, 907, L1 [Google Scholar]
- Yoon, Y., & Lim, G. 2020, ApJ, 905, 154 [Google Scholar]
- Yoon, Y., & Park, C. 2020, ApJ, 897, 121 [Google Scholar]
- Yoon, Y., Park, C., Chung, H., et al. 2022, ApJ, 925, 168 [NASA ADS] [CrossRef] [Google Scholar]
- Yoon, Y., Ko, J., & Kim, J.-W. 2023, ApJ, 946, 41 [Google Scholar]
- Yoon, Y., Kim, J.-W., & Ko, J. 2024a, ApJ, 974, 299 [Google Scholar]
- Yoon, Y., Ko, J., Chung, H., et al. 2024b, ApJ, 965, 158 [NASA ADS] [CrossRef] [Google Scholar]
- Zhao, Y., Li, Y. A., Shangguan, J., et al. 2022, ApJ, 925, 70 [Google Scholar]
It is defined as the ratio between the amplitude of the Gaussian-modeled emission line and the dispersion of the continuum residual.
Our main findings are similarly obtained when using the luminosity of the broad Hα emission as a proxy for AGN luminosity, instead of L[O III]. However, to ensure consistency and facilitate comparison with other studies, we adopted L[O III] as an indicator of AGN luminosity throughout this study.
The emission line classification information is obtained from the Max Planck Institute for Astrophysics–Johns Hopkins University (MPA–JHU) catalog (http://www.sdss.org/dr17/spectro/galaxy_mpajhu/).
MBH/109 M⊙ = 0.49(Mbul/1011 M⊙)1.17.
The decompositions are conducted using the de Vaucouleurs plus exponential disk model.
The image depth in the g and r bands is approximately 1 magnitude deeper than that in the z band.
In this study, the uncertainties of fT are given by the standard error of the proportion,  . These errors are nearly identical to those obtained from the bootstrapping method (resampling 2000 times for each bin), differing by no more than ∼1–2%.
All Tables
All Figures
|
Fig. 1. Distributions of type 1 AGNs in the redshift vs. log MBH plane. Type 1 AGNs are indicated by colored circles, with the color representing log L[O III]. See the color bar for the color scale. |
| In the text | |
|
Fig. 2. Histograms of the normalized distributions of redshift and log MBH (or equivalently, log Mbul) for the type 1 AGN sample and the matched inactive control sample. |
| In the text | |
|
Fig. 3. Examples of type 1 AGN hosts with tidal features, which have log(L[O III]/erg s−1) > 41.4. First row: Color images from SDSS. The galaxy ID is provided. The horizontal bar indicates the angular scale of the image. Second row: r-band deep images of the DESI Legacy Imaging Survey. The angular scale of the deep image matches that of the color image in the first row. Third row: Optical spectra of type 1 AGNs covering the observed wavelength range 4700–7400Å, in which Hβ, [O III], and Hα emission lines are visible. Also shown are the values of log L[O III] and log MBH, where L[O III] is in units of erg s−1 and MBH is in units of solar mass (M⊙). |
| In the text | |
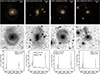 |
Fig. 4. Same as Fig. 3 but for 41.1 < log(L[O III]/erg s−1) < 41.5. |
| In the text | |
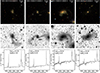 |
Fig. 5. Same as Fig. 3 but for 40.4 < log(L[O III]/erg s−1) < 41.1. |
| In the text | |
|
Fig. 6. Same as Fig. 3 but for type 1 AGN hosts that do not have tidal features. The AGNs are ordered by decreasing L[O III] from left to right. |
| In the text | |
|
Fig. 7. Distribution of type 1 AGNs in the plane of logarithmic values of MBH vs. L[O III] (or Lbol). AGNs are categorized according to the presence or absence of tidal features. The solid black lines indicate constant values of LEdd, 0.1LEdd, and 0.01LEdd. |
| In the text | |
|
Fig. 8. Distributions of log L[O III], log MBH, and log λEdd for AGN hosts with and without tidal features. The vertical dashed lines represent the median value of each parameter for the two AGN categories. The gray vertical lines indicate the full range of each parameter. |
| In the text | |
|
Fig. 9. Top panels: fraction of type 1 AGN hosts with tidal features (fT) as a function of log L[O III], log MBH, and log λEdd. The error bar indicates the standard error of the proportion. Bottom panels: excess of fT (eT) as a function of log L[O III], log MBH, and log λEdd, defined as the ratio of fT for AGNs to that of the matched inactive control sample. The dashed lines represent the range of the error value, computed through error propagation from the standard errors of the two proportions. The horizontal lines in the bottom panels represent eT = 1, which indicates that the fT of AGNs is identical to that of the inactive control sample. The gray vertical lines in all the panels mark the boundaries of the bins. The bin sizes in the bottom panels are set to be slightly larger (and hence there is a smaller number of bins) than those in the top panels, in order to reduce the larger uncertainties arising from the error propagation of the two proportion errors. |
| In the text | |
|
Fig. 10. Fraction of type 1 AGN hosts with tidal features (fT) and its excess (eT), defined as the ratio of fT for AGNs to that of the matched inactive control sample, shown using colors and contours in the log MBH vs. log L[O III] plane (the left panel is for fT, while the right panel is for eT). See the color bars for the color-coded representations of fT and eT. The values in the middle of the contour lines denote fT or eT. To create color maps and contours, we used a grid with block sizes of 0.23 dex and 0.30 dex along the log MBH and log L[O III] axes, respectively. At each grid point, we calculated fT using a rectangular bin with side lengths of 1.38 dex and 1.80 dex along the log MBH and log L[O III] axes, respectively, and computed eT using a rectangular bin with side lengths of 1.84 dex and 2.40 dex. Using a larger bin size than the grid block size to compute the parameters smooths the color maps and contours, revealing the large-scale trends more clearly. We display only the colored bins for which more than 10 and 25 AGNs are used to compute fT and eT, respectively. |
| In the text | |
Current usage metrics show cumulative count of Article Views (full-text article views including HTML views, PDF and ePub downloads, according to the available data) and Abstracts Views on Vision4Press platform.
Data correspond to usage on the plateform after 2015. The current usage metrics is available 48-96 hours after online publication and is updated daily on week days.
Initial download of the metrics may take a while.