Open Access
Fig. 8.
Download original image
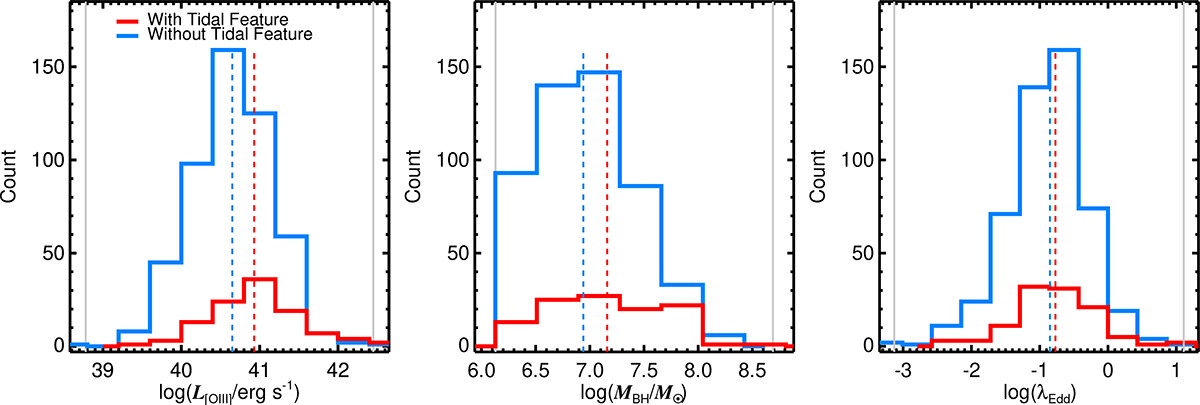
Distributions of log L[O III], log MBH, and log λEdd for AGN hosts with and without tidal features. The vertical dashed lines represent the median value of each parameter for the two AGN categories. The gray vertical lines indicate the full range of each parameter.
Current usage metrics show cumulative count of Article Views (full-text article views including HTML views, PDF and ePub downloads, according to the available data) and Abstracts Views on Vision4Press platform.
Data correspond to usage on the plateform after 2015. The current usage metrics is available 48-96 hours after online publication and is updated daily on week days.
Initial download of the metrics may take a while.