Fig. 9.
Download original image
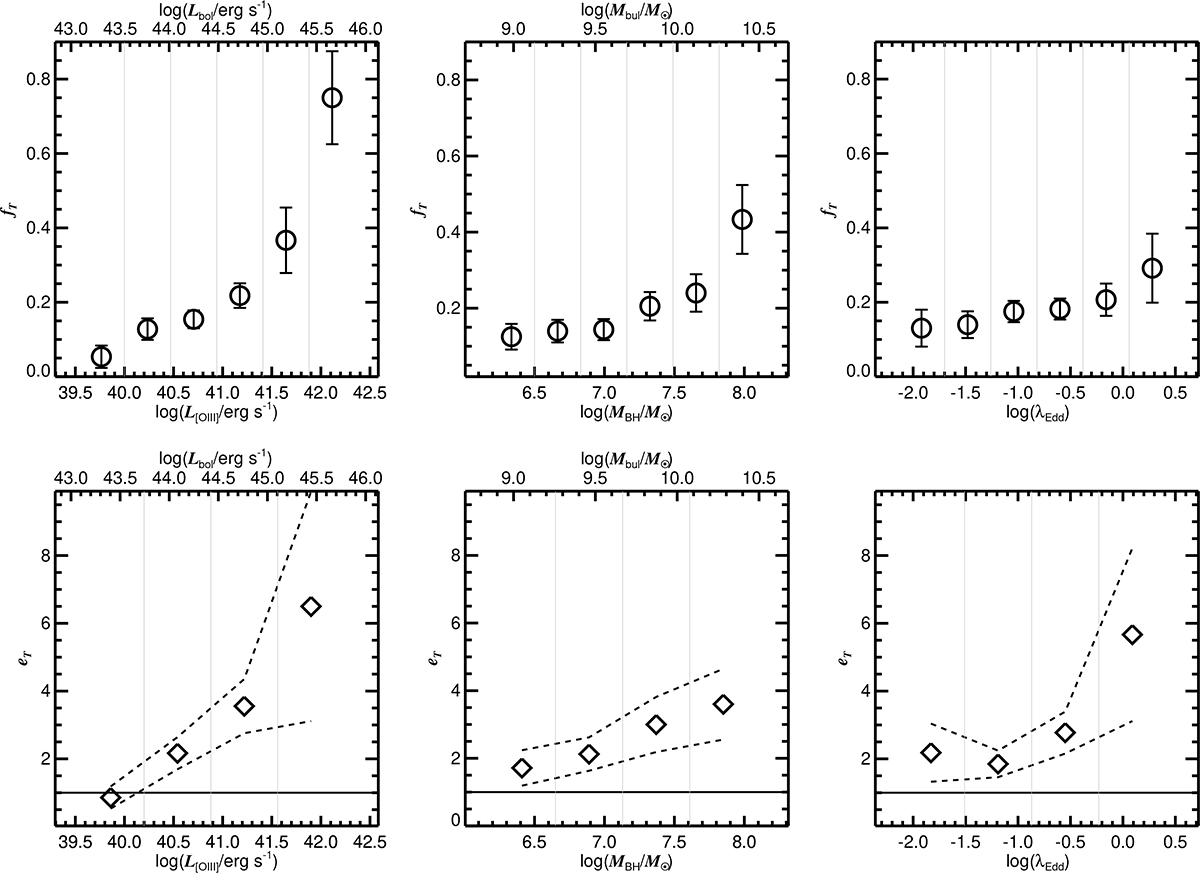
Top panels: fraction of type 1 AGN hosts with tidal features (fT) as a function of log L[O III], log MBH, and log λEdd. The error bar indicates the standard error of the proportion. Bottom panels: excess of fT (eT) as a function of log L[O III], log MBH, and log λEdd, defined as the ratio of fT for AGNs to that of the matched inactive control sample. The dashed lines represent the range of the error value, computed through error propagation from the standard errors of the two proportions. The horizontal lines in the bottom panels represent eT = 1, which indicates that the fT of AGNs is identical to that of the inactive control sample. The gray vertical lines in all the panels mark the boundaries of the bins. The bin sizes in the bottom panels are set to be slightly larger (and hence there is a smaller number of bins) than those in the top panels, in order to reduce the larger uncertainties arising from the error propagation of the two proportion errors.
Current usage metrics show cumulative count of Article Views (full-text article views including HTML views, PDF and ePub downloads, according to the available data) and Abstracts Views on Vision4Press platform.
Data correspond to usage on the plateform after 2015. The current usage metrics is available 48-96 hours after online publication and is updated daily on week days.
Initial download of the metrics may take a while.