Open Access
Fig. 1
Download original image
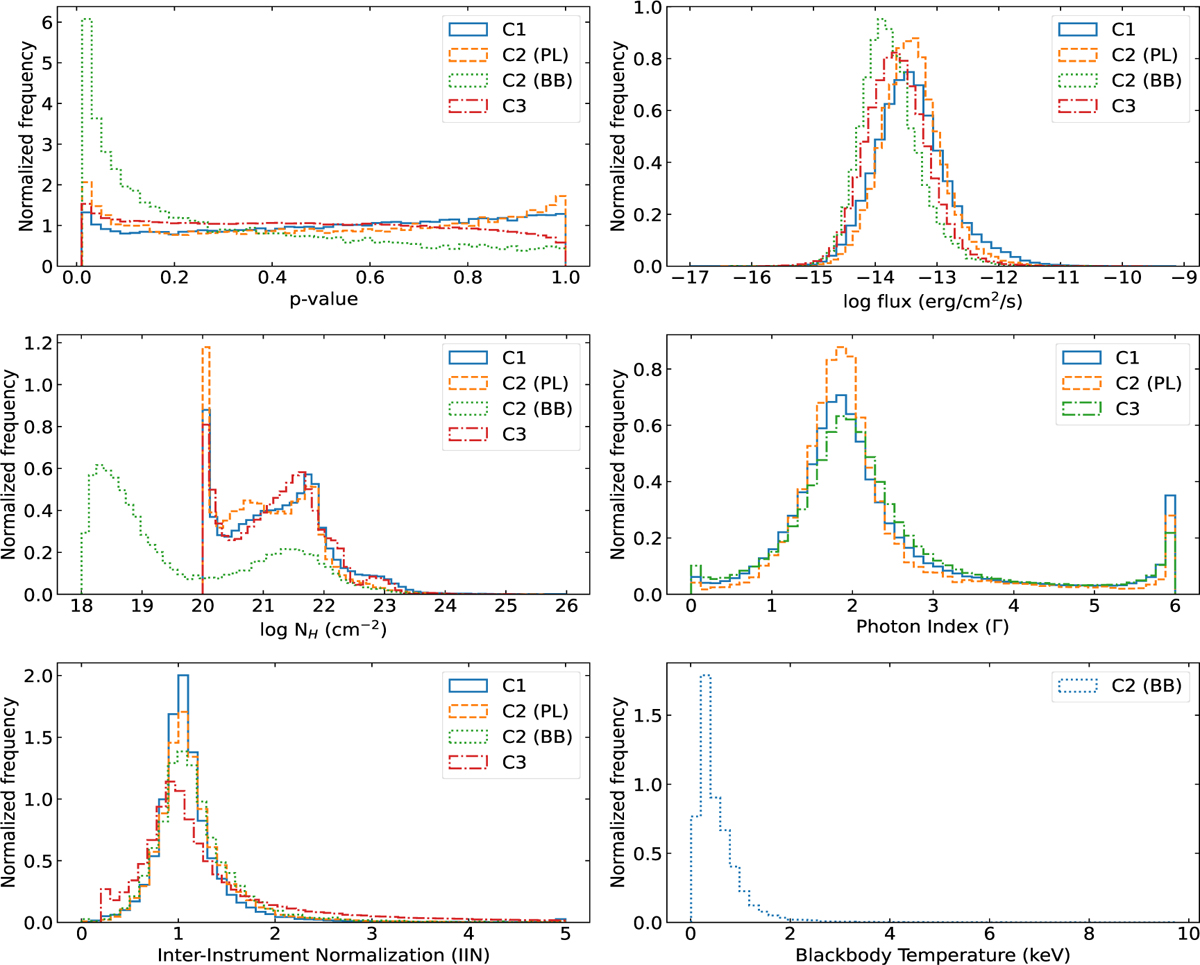
Distributions of the p-values (top-left panel), flux (top-right panel), NH (middle-left panel), photon index (middle-right panel), IIN (bottomleft panel) and black-body temperature (bottom-right panel) of the sources included in the Good-fit samples of C1, C2, and C3, as indicated in the legends.
Current usage metrics show cumulative count of Article Views (full-text article views including HTML views, PDF and ePub downloads, according to the available data) and Abstracts Views on Vision4Press platform.
Data correspond to usage on the plateform after 2015. The current usage metrics is available 48-96 hours after online publication and is updated daily on week days.
Initial download of the metrics may take a while.