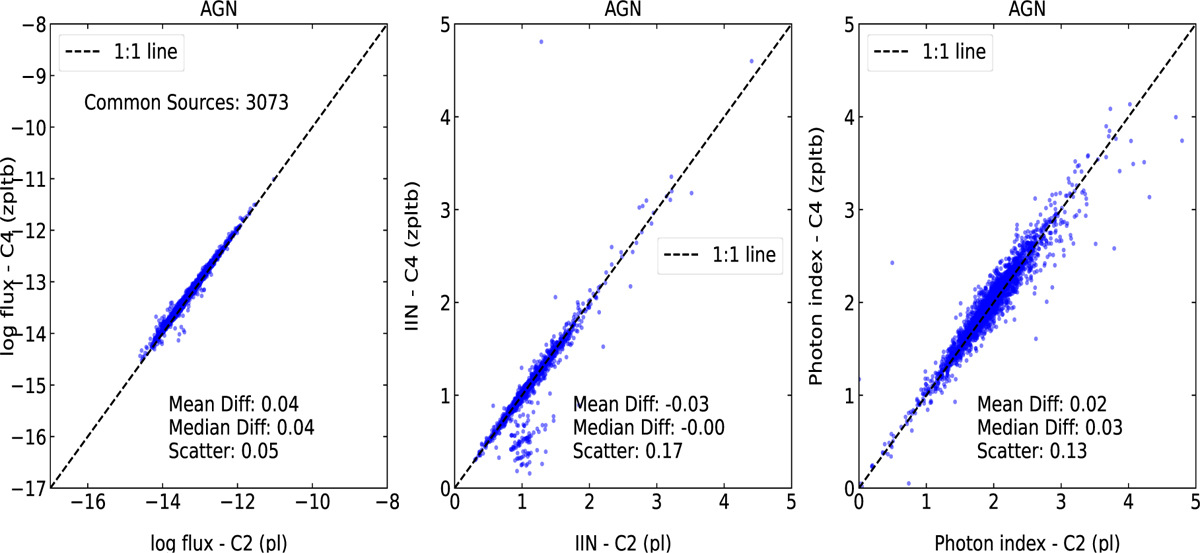
Fig. A.6
Download original image
Comparison of fX (left panel), IIN (middle panel), and Γ (right panel) measurements for sources within the C4 catalogue, where the zpltb model is utilised for spectral fitting (i.e., AGNs), with corresponding measurements from C2, employing a power-law model for spectral fitting. Each panel displays the mean, median difference, and scatter. Sources included in the Good-fit samples are presented.
Current usage metrics show cumulative count of Article Views (full-text article views including HTML views, PDF and ePub downloads, according to the available data) and Abstracts Views on Vision4Press platform.
Data correspond to usage on the plateform after 2015. The current usage metrics is available 48-96 hours after online publication and is updated daily on week days.
Initial download of the metrics may take a while.