Fig. 2
Download original image
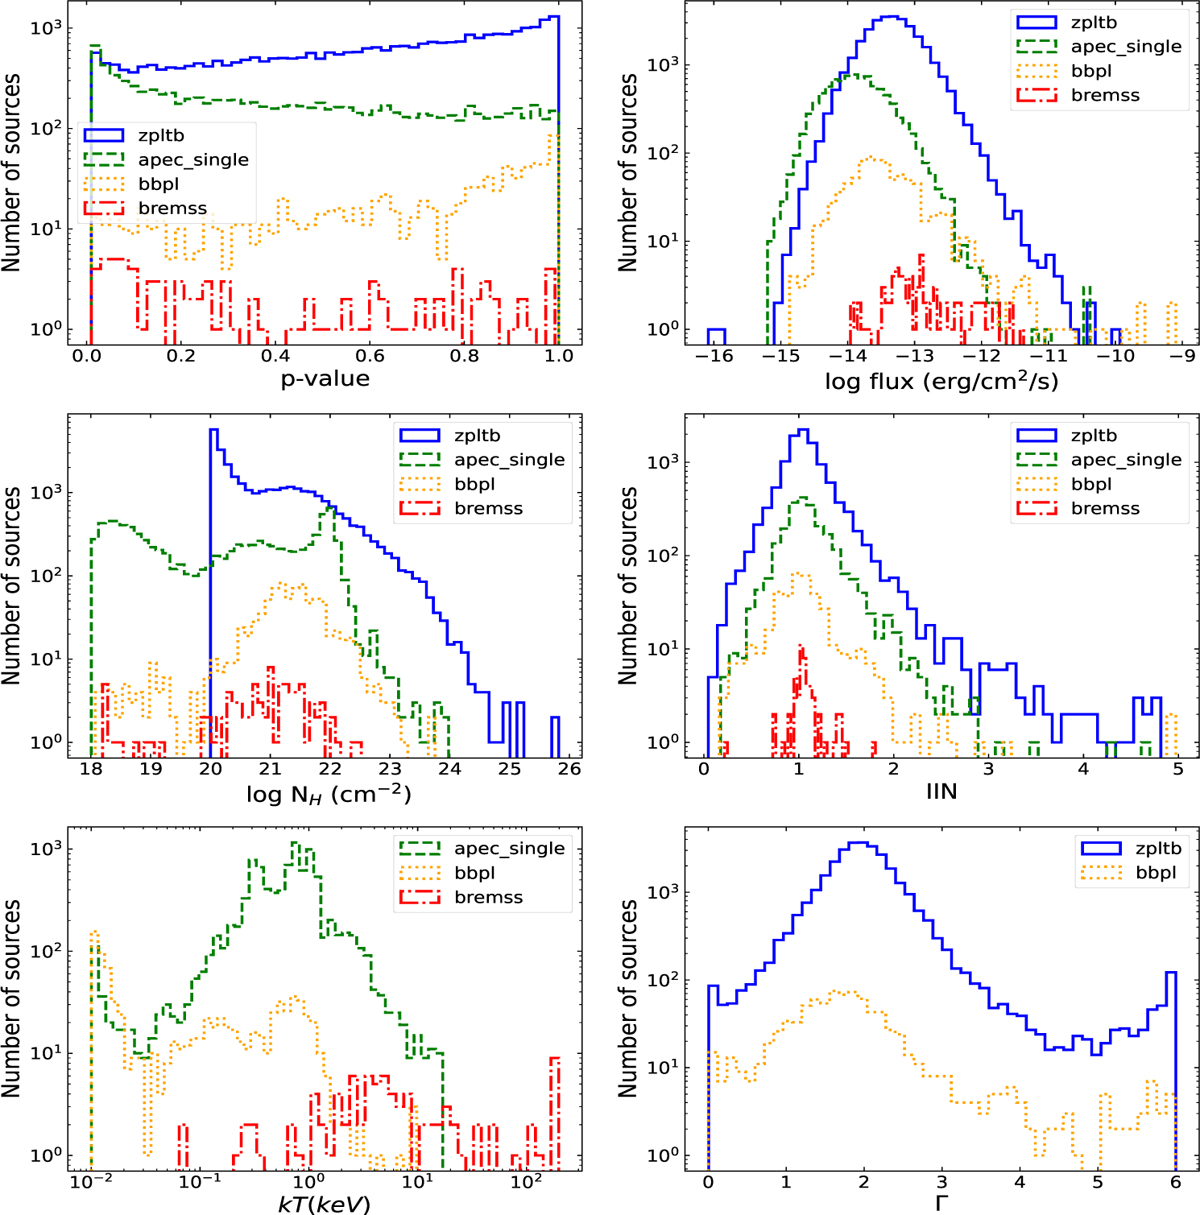
Distributions of the p-values (top-left panel), flux (top-right panel), NH (middle-left panel), IIN (middle-right panel), black-body temperature (bottom-left panel) and photon index (bottom-right panel) of the sources included in the Good-fit sample of C4. Blue lines present the results for AGNs (zpltb model), green lines display the measurements for stars (APEC model), orange lines show the calculations for XRBs (bbpl model) and red lines illustrate the results for CVs (bremss model).
Current usage metrics show cumulative count of Article Views (full-text article views including HTML views, PDF and ePub downloads, according to the available data) and Abstracts Views on Vision4Press platform.
Data correspond to usage on the plateform after 2015. The current usage metrics is available 48-96 hours after online publication and is updated daily on week days.
Initial download of the metrics may take a while.