Fig. 3
Download original image
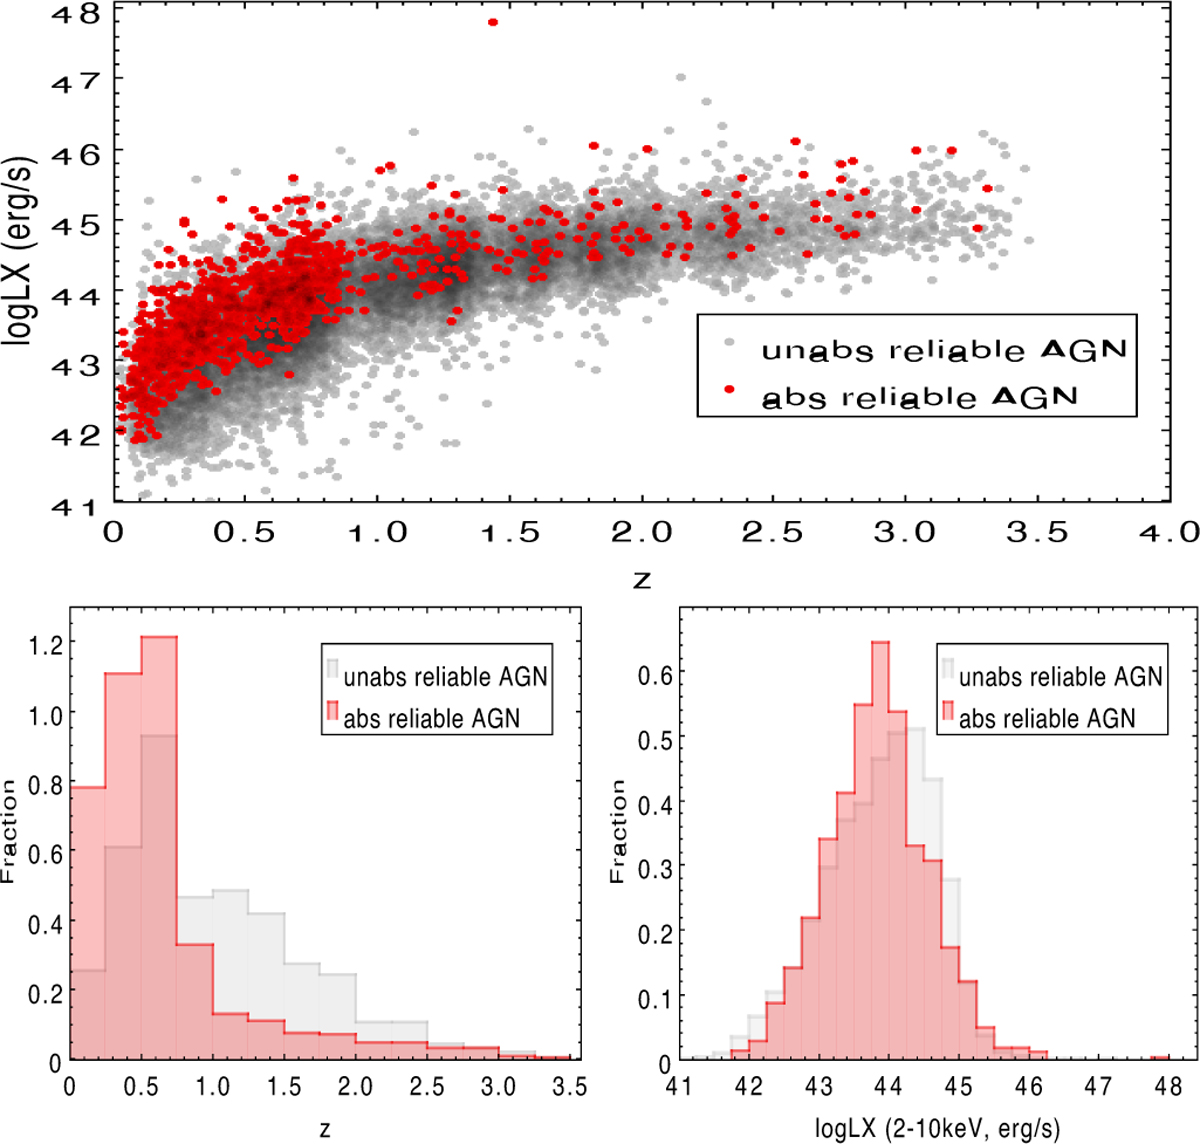
Distribution of 2−10 keV rest-frame intrinsic luminosity LX and redshift z of the reliable AGN sample. In the top panel, the grey and red dots correspond to unabsAGN and absAGN, respectively. Note that due to the discreteness of the zmode 0 from tpz (see the text for the details), the red-shift value plotted here is offset by a random number between −0.05 and 0.05. Bottom panels show the histograms of the redshift (left) and luminosity (right) of the Good-fit and reliable absAGN and unabsAGN samples.
Current usage metrics show cumulative count of Article Views (full-text article views including HTML views, PDF and ePub downloads, according to the available data) and Abstracts Views on Vision4Press platform.
Data correspond to usage on the plateform after 2015. The current usage metrics is available 48-96 hours after online publication and is updated daily on week days.
Initial download of the metrics may take a while.