Open Access
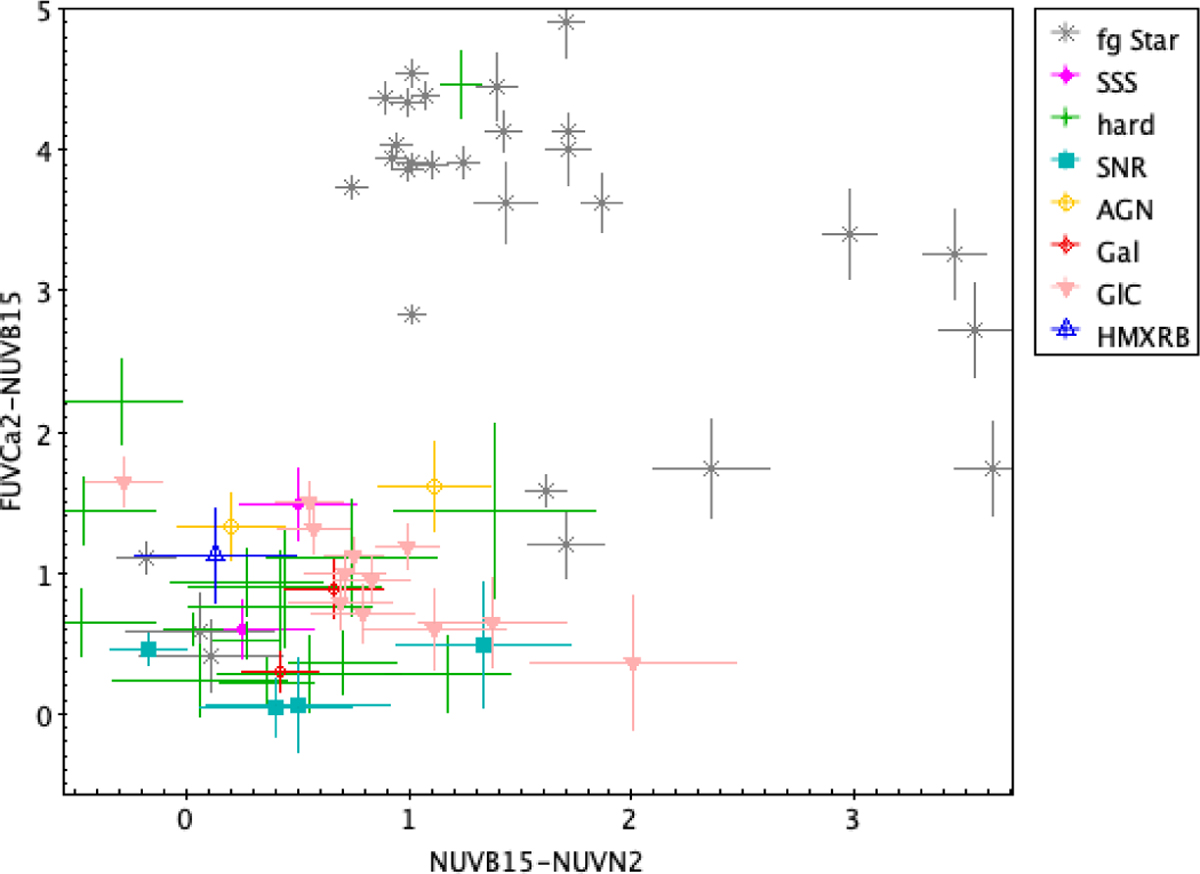
Fig. 1
Download original image
Colour-colour UV diagram for X-ray sources with UV counterparts, plotting NUVB15 – NUVN2 AB magnitude on the x-axis vs. FUVCaF2 – NUVB15 AB magnitude on the y-axis. The different symbols and colours indicate the different updated source classifications.
Current usage metrics show cumulative count of Article Views (full-text article views including HTML views, PDF and ePub downloads, according to the available data) and Abstracts Views on Vision4Press platform.
Data correspond to usage on the plateform after 2015. The current usage metrics is available 48-96 hours after online publication and is updated daily on week days.
Initial download of the metrics may take a while.