| Issue |
A&A
Volume 704, December 2025
|
|
|---|---|---|
| Article Number | A235 | |
| Number of page(s) | 12 | |
| Section | Catalogs and data | |
| DOI | https://doi.org/10.1051/0004-6361/202555294 | |
| Published online | 16 December 2025 | |
AstroSat UVIT counterparts of XMM-Newton X-ray sources in M31
1
Jülich Supercomputing Centre, Forschungszentrum Jülich, Wilhelm-Johnen-Straße,
52428
Jülich,
Germany
2
Institute of Astronomy, National Tsing Hua University,
No. 101 Sect. 2 Kuang-Fu Road,
30013
Hsinchu,
Taiwan
★ Corresponding authors: This email address is being protected from spambots. You need JavaScript enabled to view it.
; This email address is being protected from spambots. You need JavaScript enabled to view it.
Received:
25
April
2025
Accepted:
14
October
2025
Abstract
Context. The X-ray source population of M 31 has been intensively studied in numerous investigations using X-ray telescopes. A notable example is the Deep XMM-Newton survey of M 31, which covered the entire D25 ellipse down to a limiting luminosity of ~1035 erg s−1 in the 0.2–4.5 keV band.
Aims. We aimed to identify UV counterparts of the X-ray sources detected with XMM-Newton using the M 31 UVIT catalogue, which is based on AstroSat observations.
Methods. We studied the UV colour-colour diagram of the counterparts and fitted the UV spectra with simple phenomenological models that provide formally acceptable fits for about 35 per cent of the sources. We also analysed the X-ray spectral properties and their temporal evolution, based on the X-ray spectral fits of the XMM2Athena project. We updated the classification of XMM-Newton sources with UVIT counterparts, where necessary, by verifying cross-correlations with more recent studies.
Results. In the UV colour-colour diagram, we find one source that is classified as ‘hard’ in a region where, apart from this source, only foreground stars are located. Apart from foreground stars (23) and hard sources (13), sources located in globular clusters (6) are most numerous among those with UV counterparts that yield statistically acceptable fits with our simple models. We used UVIT data together with XMM-Newton optical monitor data to investigate the spectral energy distributions of the sources. This enabled us to suggest classifications for sources previously classified as hard sources in earlier studies. We provide an updated classification for 24 of the 291 XMM-Newton sources with UVIT counterparts. The list thus contains (including candidates of each class): 105 foreground stars, 22 globular clusters, 11 supernova remnants, nine X-ray binaries, of which six are suggested as high-mass X-ray binary candidates, eight galaxies, eight AGNs, seven supersoft source candidates, two sources that are either an X-ray binary or a galaxy, and another one that is either a galaxy or a globular cluster. A total of 107 sources can still only be classified as hard, while nine remain unclassified.
Key words: galaxies: individual: M 31 / ultraviolet: galaxies / X-rays: galaxies
© The Authors 2025
 Open Access article, published by EDP Sciences, under the terms of the Creative Commons Attribution License (https://creativecommons.org/licenses/by/4.0), which permits unrestricted use, distribution, and reproduction in any medium, provided the original work is properly cited.
This article is published in open access under the Subscribe to Open model. This email address is being protected from spambots. You need JavaScript enabled to view it. to support open access publication.
1 Introduction
The Andromeda Galaxy, or M 31, is the closest large spiral galaxy to the Milky Way. The well-known distance to M 31 of 785 ± 25 kpc (McConnachie et al. 2005) and the moderate Galactic foreground absorption (Stark et al. 1992, NH=7×1020 cm−2) make it an ideal target for studying source populations. Consequently, numerous studies have investigated its X-ray source population. Early studies were conducted with the Einstein satellite (van Speybroeck et al. 1979; Collura et al. 1990; Trinchieri & Fabbiano 1991) and the Roentgen satellite (ROSAT; Primini et al. 1993; Supper et al. 1997, 2001). Notable studies with Chandra, which mainly cover the central part of M 31, include Garcia et al. (2000); Di Stefano et al. (2002); Kaaret (2002); Kong et al. (2002); Di Stefano et al. (2004); Williams et al. (2004); Voss & Gilfanov (2007); Hofmann et al. (2013); Williams et al. (2018). Studies based on XMM-Newton data include Osborne et al. (2001); Orio et al. (2010); Pietsch et al. (2005, 2007); Henze et al. (2010, 2011, 2014). A more detailed overview of studies published before 2011 is provided by Stiele et al. (2011). The X-ray source population at higher energies (> 10 keV) has been studied using data from the Nuclear Spectroscopic Telescope Array (NuSTAR; e.g. Maccarone et al. 2016; Yukita et al. 2017; Stiele & Kong 2018).
Using the Galaxy Evolution Explorer (GALEX; Morrissey et al. 2007), Thilker et al. (2005) observed M 31 in the far-UV (154 nm) and near-UV (232 nm), with a spatial resolution of ~5″. Catalogues of star-forming regions (Kang et al. 2009) and star clusters (Kang et al. 2012) have also been published.
In this work, we present an analysis of M 31 sources detected in both UV and X-rays. We use the Deep XMM-Newton survey of M 31 (Stiele et al. 2011), which covers its entire D25 ellipse, and the M 31 Ultra-Violet Imaging Telescope (UVIT) catalogue (Leahy et al. 2020). We provide a brief description of both catalogues in Sect. 2. We describe the analysis, including source cross-identification in Sect. 3. We present our results in Sect. 4 and discuss them in Sect. 5. A study of UVIT counterparts of Chandra sources, which are located mainly in the bulge of M 31, is presented in Leahy & Chen (2020).
2 Catalogues
2.1 The Deep XMM-Newton survey of M 31
XMM-Newton is a European X-ray satellite (Jansen et al. 2001). The observations of the Deep XMM-Newton survey of M 31 were obtained with the European Photon Imaging Camera (EPIC), which consists of three CCD cameras: one equipped with a pn detector (Strüder et al. 2001), and two using metal oxide semi-conductor (MOS) arrays (Turner et al. 2001). Each camera has a field of view of ~30′ in diameter and provides scientific data in the 0.2–12 keV range.
The Deep XMM-Newton survey of M 31 covers the entire D25 ellipse down to a limiting luminosity of ~1035 erg s−1 in the 0.2–4.5 keV band. It consists of 22 fields observed between 2000 and 2008, some of which were observed multiple times (see Table 2 of Stiele et al. 2011). Stiele et al. (2011) provide more details on the Deep XMM-Newton survey of M 31, including astrometrical corrections.
2.2 M 31 UVIT catalogue
The Ultra-Violet Imaging Telescope (UVIT; Tandon et al. 2017) on-board AstroSat (Singh et al. 2014) consists of two 38 cm telescopes, one covering the far-ultraviolet (FUV) between 130–180 nm and the other observing in the near-ultraviolet (NUV; 200–300 nm). Observations of the M 31 UVIT survey were taken in the following filters: CaF2 (123–173 nm), BaF2 (135–173 nm), Sapphire (146–175 nm), Silica (165–178 nm), NUVB15 (206–233 nm), and NUVN2 (275–284 nm).
Because the field of view of each UVIT telescope is ~28′ in diameter, 19 different fields are needed to cover the large area of M 31 (see Table 1 of Leahy et al. 2020). This number of fields, together with the fact that each observation can be taken in only one filter, means that the observations are spread out in time. The observations cover nearly the entire D25 ellipse of M 31, except for small regions at the northern and southern ends and one field (number eight) located in the northern disc, whose data were unusable due to a pointing issue with the satellite during that observation (see also Fig. 2 of Leahy et al. 2020). For the entire survey, the completeness limits (peak of the magnitude distribution) are mAB ≈ 23 for the CaF2, BaF2, and Sapphire bands, ≈22 for the NUVB15 and Silica bands, and ≈21 for the NUVN2 band. This implies that the UV emission expected from the companion stars of low-mass X-ray binaries lies below the sensitivity limit of the UVIT catalogue. The UV emission of globular clusters in M 31, which originates from blue horizontal branch stars, can be detected (Leahy & Chen 2020; Johnson et al. 2015). Leahy et al. (2020) provide further details on the M 31 UVIT catalogue, including the temporal and spatial spacing of the observations.
3 Analysis
3.1 Cross-matching sources
3.1.1 XMM-Newton/EPIC and UVIT
To cross-correlate the sources in both catalogues, we first examined the position uncertainties. For more than 99.6% of the XMM-Newton sources, the uncertainties are smaller than 10″. Therefore, we correlated the XMM-Newton source catalogue with the UVIT source lists using a maximum correlation radius of 10″. Since the position uncertainty of the UVIT sources is typically less than 1″ (Leahy et al. 2020), we regarded sources as counterparts if their positions agreed within the X-ray position error plus one arc-second. Using this criterion, we identified 291 counterparts: 229 in the FUVCaF2 band, 167 in the NUVB15 band, 145 in the NUVN2 band, 91 in the FUVSilica band, 80 in the FUVSapphire band, and 17 in the FuVBaF2 band. Because certain filters only cover a small area of the M 31 disc, we detected only two sources in five filters, 58 in four filters, 46 in three filters, 116 in two filters, and 117 are detected in a single filter. Eighty sources were detected in the FUVCaF2, NUVB15, and NUVN2 bands.
To estimate the number of spurious cross-matches, we shifted the declination of the XMM-Newton sources by 1′ and repeated the correlation with the UVIT sources. This yielded 101 counterparts in the FUVCaF2 band, 65 in the NUVB15 band, 35 in the NUVN2 band, 26 in the FUVSilica band, 13 in the FUV-Sapphire band, and four in the FuVBaF2 band. This indicates that the fraction of spurious cross-matches was between ~16 and 44 per cent, depending on the UV band.
3.1.2 XMM-Newton/OM
In a next step, we correlated the catalogue of XMM-Newton/EPIC and UVIT sources with the XMM-Newton Optical Monitoring (OM) Serendipitous Ultraviolet Source Survey (SUSS) catalogue v.5.0 (Page et al. 2012), which provides magnitudes and fluxes in six filters: UVW2 (187–237 nm), UVM2 (207–255 nm), UVW1 (249.5–332.5 nm), U (302–386 nm), B (397.5–502.5 nm), and V (508–578 nm). As before, we used a maximum correlation radius of 10″. We considered sources as counterparts if their positions agreed within the X-ray position error plus the positional error given in the XMM-OM-SUSS catalogue. Using this criterion, we identified 198 counterparts: 38 in the UVW2 band, 118 in the UVM2 band, 182 in the UVW1 band, 17 in the U band, 16 in the B band, and 11 in the V band. Four sources are detected in all six filters, seven in five filters, nine in four filters, 12 in three filters, 85 in two filters, and 81 in only one filter. Following the same procedure as in Sect. 3.1.1, we obtained 28 cross-matches between the moved positions of XMM-Newton sources and OM SUSS catalogue entries.
3.1.3 GALEX
Cross-correlating the list of XMM-Newton X-ray sources with Astrosat/UVIT counterparts against the catalogue of GALEX star clusters (Kang et al. 2012) yielded 20 matches. Checking for spurious correlations by moving the declination of the XMM-Newton sources by one arc-minute does not produce any cross-matches. Among the 20 sources, 19 are classified as globular clusters, while source 934 is classified as a supersoft source. The position of this source is consistent, within errors, with the position of the globular cluster Bol 111 listed in the GALEX catalogue.
3.2 Spectral fits
3.2.1 UVIT spectra
We performed fits of the UVIT spectra using Xspec (Arnaud 1996). We fitted the UVIT spectra with two simple, phenomenological models, including absorption: a power-law model and a blackbody model. The blackbody model approximates stellar spectra, as expected from foreground stars within our own Galaxy, or sufficiently bright stars in M 31. The power-law model provides a better fit to accreting sources, such as active galactic nuclei (AGNs) and X-ray binaries during outburst, which show excess emission. It also approximates the emission of a population of thermal sources, in which case high photon indexes (>3) are obtained.
We included only non-overlapping spectral bands in the fits, namely the NUV spectra, if present, and one of the FUV spectra, if present. For the FUV spectra, we chose the band with the broadest wavelength coverage. Applying this selection criterion produces UVIT spectra with at most three spectral bins. We transformed the UVIT magnitudes (and errors) to fluxes using the following relation:
![Mathematical equation: $\[f_i=10^{0.4 *\left(8.9-{ ABmag }_i\right)} /\left(3.34 \times 10^4 * \lambda_i^2\right) * \Delta \lambda_i,\]$](/articles/aa/full_html/2025/12/aa55294-25/aa55294-25-eq1.png) (1)
(1)
where fi is the flux in erg s−1 cm−2, λi the centroid wavelength, and Δλi the width of band i in Å. We also transformed the wavelength ranges of the different bands to energies. We modelled the absorption in the UVIT spectra using the redden model. For UVIT spectra in three channels, the free parameters are the absorption, the photon index and normalisation for the power-law fits, and the disc temperature and radius for the blackbody fits. If only two UVIT channels were available, we fixed the absorption at the foreground value in the direction of M 31, 0.21. For sources with a spectrum in only one UVIT band, we were unable to fit the spectrum.
3.2.2 X-ray spectra
For the X-ray spectra, we used the fits provided by the XMM2Athena project1 (Webb et al. 2023). These fits provide spectral parameters for all spectra in the XMM-Newton source catalogue 4XMM-DR11 (Webb et al. 2020) that were obtained using a Bayesian approach with an absorbed power-law model. A detailed description of the fitting procedure and the resulting catalogue can be found in Carrera & Stiele (2022) and Viitanen et al. (2025). We cross-correlated our source list with the XMM-Newton source catalogue and, for each source, we selected all detections for which spectral fits are available in the XMM2Athena project catalogue. For sources detected multiple times, we derived the mean of each spectral parameter, considering only detections for which a formally acceptable fit (flag = 0) is available. We also derived the variability of each parameter, Pvar = Pmax/Pmin, and the corresponding significance:
![Mathematical equation: $\[S_{\mathrm{var}}=\left(P_{\max }-P_{\min }\right) / \sqrt{e P_{\max }^2+e P_{\min }^2},\]$](/articles/aa/full_html/2025/12/aa55294-25/aa55294-25-eq2.png) (2)
(2)
where Pmax and Pmin are the maximum and minimum values of the parameter and ePmax and ePmin are the corresponding uncertainties (Stiele et al. 2008). For two sources (42 and 934), although each is observed three times, no formally acceptable fit is reported. Hence, we used the mean values of the spectral parameters obtained from the detections with a formally unacceptable source fit (flag = 4 in the XMM2Athena project catalogue)2.
3.2.3 UVIT-X-ray spectra
To estimate how the flux changes between the UVIT and X-ray bands, the combined UV-X-ray spectra can in principle be fitted with an absorbed power-law model. As we have at most five UVIT bands, and fewer for most sources, the fits would be heavily dominated by the X-ray data points. We therefore followed Leahy & Chen (2020) to estimate the evolution of the power-law index between the UVIT and X-ray bands by deriving the inclination between the soft X-ray band (0.5–2 keV) and the highest-energy UVIT band, using
![Mathematical equation: $\[\alpha_{\mathrm{uvx}}=-\frac{\log \left(f_{\mathrm{xs}}\right)-\log \left(f_{\mathrm{uvh}}\right)}{\log 1.25-\log \left(e_{\mathrm{uvh}}\right)},\]$](/articles/aa/full_html/2025/12/aa55294-25/aa55294-25-eq3.png) (3)
(3)
where fxs and fuvh are the flux in the soft X-ray and hardest UV bands, respectively, and euvh is the mean energy of the hardest UVIT band. The minus sign ensures that αuvx is consistent with the definition of the photon index used in the Xspec power-law model.
3.3 Spectral energy distributions
For the optical and UV spectra of the 325 possible counterparts, we also investigated the spectral energy distributions (SEDs) using the Virtual Observatory SED Analyzer (VOSA; Bayo et al. 2008). We created SEDs with the XMM-Newton/OM and AstroSat/UVIT data and uploaded them to VOSA. We then used VOSA’s build SED function to search additional photometry for our sources in VO catalogues. The resulting enhanced SEDs were then analysed within VOSA using the available theoretical spectral models, primarily those for stellar spectra, with their default parameter settings. For the visual extinction, we used VOSA’s built-in capability to search for extinctions. For sources classified as foreground stars or foreground star candidates, we limited the extinction to values between 0 and 0.21, except for sources where VOSA indicated a higher extinction. In such cases, we increased the upper limit of the extinction range to accommodate this value. For all other classified sources that are assumed to be located in or behind M 31, including hard sources, we set the extinction to values between 0.21 and 2, unless VOSA indicates an extinction < 0.21, in which case we used 0 as the lower boundary. For the few unclassified sources, we set the extinction between 0 and 2.
3.4 Updated classifications
We checked the source classifications of the 291 XMM-Newton sources with UVIT counterparts against more recent studies to determine whether the classifications provided in Stiele et al. (2011) required updating. This was particularly important for sources that were only classified as hard, a category assigned when insufficient information was available to determine whether a source was an X-ray binary, a Crab-like supernova remnant, or an AGN. We began with the catalogue of Chandra sources with HST counterparts compiled by Williams et al. (2018). Cross-matching the sources was straightforward here, as the Williams et al. (2018) catalogue includes identifiers from Stiele et al. (2011) for sources common to both catalogues. Of the 291 XMM-Newton sources, 36 sources are listed in the catalogue of Williams et al. (2018), which provides source classifications from the Panchromatic Hubble Andromeda Treasury (PHAT) survey (Dalcanton et al. 2012). Seven sources (1474, 1598, 1624, 1634, 1728, 1810, and 1811), previously classified as hard in Stiele et al. (2011), are classified as galaxy (candidates) in Williams et al. (2018). Source 1712, which was classified as a supernova remnant (SNR) candidate in Stiele et al. (2011), is also classified as a galaxy in Williams et al. (2018). Furthermore, Williams et al. (2018) provides a list of high-mass X-ray binary candidates, primarily selected based on the Hubble colours of their counterparts. Six sources (1399, 1440, 1450, 1525, 1636, and 1751), previously classified as hard in Stiele et al. (2011), appear on that list.
We also cross-correlated our list of 291 XMM-Newton sources with UVIT counterparts against the XMM-Newton source catalogue of Sasaki et al. (2018), which covers parts of the northern disc of M 31. We searched for counterparts with the smallest spatial separation within an initial cross-correlation radius of 15″. We find 44 cross-matches, all with spatial separations smaller than the sum of the position errors in both catalogues. To check for spurious correlations, we shifted the declination of the XMM-Newton sources with UVIT counterparts by 1′ and repeated the correlation. This yielded zero matches within the sum of the position errors of both catalogues. Comparing the updated source classification obtained from cross-matching with the Williams et al. (2018) catalogue and those in Sasaki et al. (2018), we find that sources 1598 and 1624 are classified as an X-ray binary and a candidate, respectively, in Sasaki et al. (2018) while they are classified as galaxies in Williams et al. (2018). In addition, source 1545, which was previously classified as hard in Stiele et al. (2011), is classified as an X-ray binary candidate in Sasaki et al. (2018).
We also cross-matched our list of 291 sources against the list of star clusters and background galaxies from the PHAT survey (Johnson et al. 2015). We used a maximum cross-correlation radius of 10″ and verified that the separation was smaller than the XMM-Newton position error plus the positional uncertainty of the optical counterpart. Among our sources not covered by the Williams et al. (2018) catalogue, two sources previously classified as hard in Stiele et al. (2011), 1205 and 1828, can be classified as counterparts of a star cluster and a galaxy, respectively.
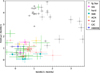 |
Fig. 1 Colour-colour UV diagram for X-ray sources with UV counterparts, plotting NUVB15 – NUVN2 AB magnitude on the x-axis vs. FUVCaF2 – NUVB15 AB magnitude on the y-axis. The different symbols and colours indicate the different updated source classifications. |
4 Results
4.1 UVIT data
For X-ray sources that have UV counterparts in the NUVB15, NUVN2, and FUVCaF2 bands, the colour-colour diagram is shown in Fig. 1. We find that the upper and right regions of the diagram, where at least one colour is ≳ 3 is (almost) exclusively populated by foreground stars. This behaviour is also observed in the study of UVIT counterparts of Chandra sources by Leahy & Chen (2020). This finding suggests that source 1502, classified only as a hard source, is most likely a foreground star, given its location in the colour-colour diagram.
We performed fits of the UV spectra using absorbed power-law and blackbody models with Xspec. Of the 133 sources with counts in two or three different UV bands, 42 yield statistically acceptable fits (![Mathematical equation: $\[\chi_{\text {red }}^{2} \leq 3\]$](/articles/aa/full_html/2025/12/aa55294-25/aa55294-25-eq4.png) ) with an absorbed power-law model including redden extinction. The observed photon indices range from −3 to 7 (red distribution in Fig. 2), where −2 corresponds to the Rayleigh-Jeans long-wavelength side of a blackbody, and high values may arise from the Wien tail. Non-thermal spectra exhibit photon indexes between 0 and 2. Among these 42 sources (indicated as filled red bars in Fig. 2) are 11 sources classified only as hard, ten foreground stars, 12 foreground star candidates, five in globular clusters, and one source belongs to each of the following classes: supernova remnant, galaxy candidate, supersoft source, and X-ray binary (Fig. 3).
) with an absorbed power-law model including redden extinction. The observed photon indices range from −3 to 7 (red distribution in Fig. 2), where −2 corresponds to the Rayleigh-Jeans long-wavelength side of a blackbody, and high values may arise from the Wien tail. Non-thermal spectra exhibit photon indexes between 0 and 2. Among these 42 sources (indicated as filled red bars in Fig. 2) are 11 sources classified only as hard, ten foreground stars, 12 foreground star candidates, five in globular clusters, and one source belongs to each of the following classes: supernova remnant, galaxy candidate, supersoft source, and X-ray binary (Fig. 3).
For nine sources with a formally acceptable power-law fit, we also obtain statistically acceptable fits using an absorbed blackbody model with redden extinction. For a further five sources, only the absorbed blackbody model yields statistically acceptable fits. For 10 sources with statistically acceptable blackbody fits, the blackbody temperature is relatively high, around ~3 keV, while for the remaining four sources, the temperature lies between 0.01 and 0.1 keV. The four sources with low blackbody temperature have best-fit emission area radii between 20 m and 2 km, while the remaining ten sources have radii of less than 10 m, assuming that they are located at the distance of M 31 (780 kpc). Of the four sources with low blackbody temperatures, three are classified as foreground stars (or candidates), and one is classified as hard. Among the remaining ten sources, four are classified as hard, one as a foreground star candidate, three as belonging to globular cluster, one as a globular cluster candidate, and one as a high mass X-ray binary.
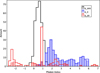 |
Fig. 2 Distribution of the photon indices in the UV (red) and X-ray (blue) bands, as well as of the UV to X-ray photon indices (black). Filled bars indicate the distributions for sources with statistically acceptable fits. |
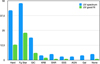 |
Fig. 3 Number of sources with a UV spectrum and a formally acceptable fit (using either the power-law or blackbody model) for different classes. |
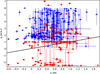 |
Fig. 4 Correlation between the UV to X-ray photon index and the UV (red square) and X-ray (blue circle) photon indices. Filled symbols indicate sources with statistically acceptable fits. The line of equal indices is shown as a solid line. |
4.2 X-ray spectra and source classification
The XMM-Newton source catalogue 4XMM-DR11 provides spectra for 206 of the 291 sources, since the spectra are only extracted for detections exceeding a certain count threshold (see Webb et al. 2020, for the exact criterion). Based on the spectral fits provided by the XMM2Athena project, 199 sources have statistically acceptable power-law fits. The distribution of the averaged median photon indices of these sources is shown in Fig. 2 (filled blue bars). The photon indices range from 0 to 6, which corresponds to the full range allowed in the fits. In terms of the UV spectra, high values indicate spectra dominated by the Wien tail of a blackbody. Therefore, at high values (>3), we mainly find supersoft sources, supernova remnants, and foreground stars. Sources powered by accretion onto a compact object, such as AGNs and X-ray binaries, are mainly found at lower values, between 1 and 3.
4.3 UVIT-X-ray spectra
We also estimated a photon index between the UV band with the highest energy and the soft (0.5–2 keV) X-ray band, as described in Sect. 3.2. We obtain values between −0.6 and 1.8 (black distribution in Fig. 2), where negative values indicate a higher flux in the soft X-ray band than in the hardest UV band and positive values indicate a UV excess relative to the soft X-rays. The relation between the UV to X-ray photon index and the UV and X-ray photon indices, respectively, is shown in Fig. 4. For 23 sources the UV to X-ray photon index agrees with the X-ray photon index within errors. An agreement within errors for the UV and UV to X-ray photon indices is found for 25 sources. For two sources, all three photon indices agree within their errors. The agreement of photon indices between different bands shows that the spectra of these bands are consistent with a single power law. The two sources where all three photon indices agree are classified as a foreground star and a supernova remnant candidate, respectively.
4.4 SED results
The SED fits with VOSA for the 325 possible counterparts of the 291 XMM-Newton sources with UVIT counterparts yield the following best-fit models. We selected the best-fit model based on the reduced χ2 value and the estimate of the visual goodness of fit derived from it, selecting models with low reduced χ2 value and visual goodness of fit. To estimate the visual goodness of fit, we assumed observational flux errors of at least two and 10%, respectively. Almost half of the counterparts, 157 in total, are best fitted with a blackbody model. The next-largest group comprises 87 counterparts whose SEDs are best fitted with a low-mass star model and includes 12 counterparts best fitted with a brown dwarf model. For seven counterparts, the SEDs are best fitted with the Koester model for white dwarfs (Koester 2010; Tremblay & Bergeron 2009), while six counterparts are best fitted with the Grams O-rich model for oxygen-rich asymptotic giant branch (AGB) stars, red supergiants, and extreme AGB stars (Sargent et al. 2011). The SEDs of 63 counterparts are best fitted with models that focus on ranges of physical parameters rather than a specific stellar class. For five counterparts, the SEDs have too few data points to fit them.
For sources best fitted with low-mass star models, 57 counterparts are best fitted with the BT-Settl and related BT models for low-mass stars and brown dwarfs (Allard et al. 2012) and nine counterparts each with the NextGen model for low and very-low mass stars (Grevesse et al. 1993; Schryber et al. 1995; Allard et al. 1997; Baraffe et al. 1997, 1998; Hauschildt et al. 1999) and the Pacheco model for hot to moderately cool subdwarf stars assuming nonlocal thermodynamic equilibrium (NLTE) (Pacheco et al. 2021). For the brown dwarf models, six counterparts are best fitted with the AMES-Cond 2000 model (Grevesse et al. 1993; Partridge & Schwenke 1997; Allard et al. 2001; Baraffe et al. 2003), three with the Atmo model for cool brown dwarfs (Phillips et al. 2020), two with the Saumon model (Saumon et al. 2012), and one with the Morley model (Morley et al. 2012, 2014a,b). For models that focus on physical parameters, 54 counterparts are best fitted with the Kurucz model, based on the opacity distribution function method to model stellar atmospheres with effective temperatures between 3500 K and 50 000 K and log g from 0.0 dex to 5.0 dex (Castelli et al. 1997; Castelli & Kurucz 2003), eight with the Coelho model (Coelho 2014), and one with the Tmap model, an NLTE metal-line blanketing model (Werner & Dreizler 1999; Rauch & Deetjen 2003; Werner et al. 2003).
The models focus on different types of stars and cover different ranges in mass, effective temperature, log g, and chemical composition. They are based on different codes to synthesise the spectra, assume either local thermodynamic equilibrium (LTE) or NLTE, and may make use of opacity distribution functions or differ in other assumptions or input data. The spectral resolution can also vary between different models. These differences mean that certain models are better suited to describe specific types of stars or provide better fits in certain wavelength ranges. A detailed description, comparison, and discussion of the advantages and limitations of these models is beyond the scope of this work.
Fig. 5 illustrates the distribution of temperatures obtained from the SED fits. Temperatures range from a few hundred to several hundred thousand Kelvin. For sources classified as foreground stars or foreground star candidates, the mean effective temperature is 5721 K with a standard deviation of 2406 K. The distribution of the effective temperature for hard sources is broad with a mean of 18 427 K, approximately three times higher than that of foreground stars, and a standard deviation of 30290 K. For sources classified as globular clusters (see Sect. 3.4), the mean effective temperature is 7489 K with a standard deviation of 4661 K, similar to that of foreground stars. For galaxies (as classified above), the mean effective temperature is 9319 K with a standard deviation of 5680 K. X-ray binaries, classified as described above, exhibit a mean effective temperature of 8200 K with a standard deviation of 6221 K, while the obtained mean effective temperature is 19 807 K with a standard deviation of 25 294 K for the counterparts of high-mass X-ray binaries (as classified by Williams et al. 2018). For sources classified as supernova remnants or candidates, the mean effective temperature is 46 477 K with a standard deviation of 63 703 K. In case of AGN, the mean effective temperature is 9221 K with a standard deviation of 5379 K. Supersoft sources show a broad distribution, with most temperatures between 6000 K and 20 000 K, but with one outlier at 400 K and another at 138 000 K.
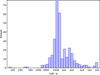 |
Fig. 5 Distribution of temperatures obtained from SED fitting. |
4.5 Description of the results catalogue
The properties of the sources in the different bands, as well as the spectral parameters in each band, are summarised in a catalogue available at the CDS. A description of its content is provided below. The catalogue has 189 columns. The first five columns provide the position and classification of the X-ray source; the next 54 columns provide the position, magnitude, and flux for each of the six AstroSat/UVIT bands. The following 11 columns provide the source identifier and the X-ray flux in the five X-ray bands from the 4XMM-DR11 catalogue. The next four columns list the identifier and position with uncertainty for the XMM-Newton/OM counterparts, followed by 24 columns that contain fluxes and magnitudes with uncertainties for each of the six OM filters. The subsequent 11 columns provide the identifier and magnitudes in the different bands of the GALEX globular cluster catalogue counterparts.
The first part of the catalogue contains the general properties, while the second part provides the spectral properties in the different bands, if available. Seventeen columns give the spectral properties of the power-law and blackbody fit in the UVIT bands. These columns are followed by 42 columns that provide the spectral parameters of the X-ray sources based on the results of the XMM2Athena project. The next two columns list the photon index and error between the UVIT and X-ray bands, derived as described in Sect. 3.2. The remaining 19 columns contain the results of the SED fitting. A detailed description of all columns is provided in the appendix.
5 Discussion
We cross-correlated X-ray sources from the Deep XMM-Newton survey of M 31 (Stiele et al. 2011) with UV sources from the Astrosat M 31 UVIT catalogue (Leahy et al. 2020).
5.1 UV spectra
Of the 291 sources, 133 have counts in at least two different Astrosat/UVIT bands. We fitted the UV spectra of these sources with absorbed power-law and blackbody models. We obtained statistically acceptable fits for only 47 of these sources. Among the five supernova remnants and candidates with UV spectra (521, 1156, 1351, 1522, and 1535), only one (1351) yields a statistically acceptable fit with the power-law model. This is not surprising, as UV spectra of supernova remnants are typically dominated by emission lines, and hence a simple power law or blackbody cannot adequately describe such spectra.
There are UV spectra for three of the sources classified as AGNs(636, 675, and 1687), but none yield a statistically acceptable fit with either an absorbed power-law or blackbody model. As with supernova remnants, this result is not surprising, since AGNs are known to exhibit strong and broad emission lines in their UV spectra. Thus, even for spectra with only a few broad bins, the presence of emission lines produces an overall spectral shape that cannot be well described with a simple power-law or blackbody model.
Among the five sources with UV spectra that are classified as galaxies or galaxy candidate (403, 793, 1063, 1598, and 1712), only one (1898) yields a statistically acceptable fit with the absorbed power-law model. As in previous cases, the disagreement of the UV spectra with a simple absorbed power-law or blackbody model can be attributed to the presence of strong absorption or emission lines in the UV spectra of galaxies. The exact composition and types of lines depend on the type of galaxy. Notably, the source with a statistically acceptable power-law fit (1598) is classified as a possible ‘very faint galaxy’ in Williams et al. (2018), whereas Williams et al. (2014) classified it as a high-mass X-ray binary candidate. The photon index obtained for this source lies at the lower end of the range for the UV spectra of sources in globular clusters. However, according to Leahy & Chen (2020), the UV emission from counterparts to globular cluster sources originates from blue horizontal branch stars in the cluster, rather than from the companion star of the X-ray binary, which would be too faint to be detected with Astrosat/UVIT. This supports the interpretation that the counterpart to the X-ray source 1598 is the very faint galaxy proposed by Williams et al. (2018), and that the UV emission originates from this galaxy. Conversely, UV spectra are available for three additional sources classified as high-mass X-ray binary candidates by Williams et al. (2018), but none yield a statistically acceptable fit. This may indicate that the UV emission is related to the source classified as an X-ray binary candidate by Williams et al. (2014), while the true counterpart of the X-ray source 1598 is the very faint galaxy proposed by Williams et al. (2018). In this scenario, the galaxy would be too faint in the UV range to be detected with Astrosat/UVIT close to the brighter UV counterpart of the assumed X-ray binary candidate. The three sources with UV spectra classified as supersoft are 857, 934, and 1242. We obtain a statistically acceptable fit for one of them (857) using the absorbed power-law model.
We find that most UV counterparts of low mass X-ray binaries are located in globular clusters. Leahy & Chen (2020) argue that the UV emission from the companion star of an X-ray binary is too faint to be detected with Astrosat/UVIT at the distance of M 31, and that in the case of globular clusters, it is the UV emission of blue horizontal branch stars that is detected. A UV spectrum is available for only one source classified as an X-ray binary, namely source 1598, which Williams et al. (2018) identified as a possible very faint galaxy (see above). UV spectra are also available for three sources (1399, 1440, and 1636) classified as high-mass X-ray binary candidates by Williams et al. (2018). However, we do not obtain a statistically acceptable fit for any of them. Among the 19 sources with UV spectra that are believed to be located in globular clusters, six yield a statistically acceptable fit with at least one of the two models: 885, 906, 1109, 1267, and 1340 with the power-law model and 885, 906, 1109, and 1205 with the blackbody model. For three of these six sources (885, 906, and 1109), both models provide statistically acceptable fits, and for all three ![Mathematical equation: $\[\chi_{\text {red;pl}}^{2}<\chi_{\text {red;bb}}^{2}\]$](/articles/aa/full_html/2025/12/aa55294-25/aa55294-25-eq5.png) .
.
Of the 100 foreground stars and foreground star candidates, we have UV spectra for 48. A statistically acceptable fit is obtained for 23 of them: 22 with the absorbed power-law model and four with the absorbed blackbody model. For three of the 23 foreground stars and foreground star candidates, both models give statistically acceptable fits, and for all three, ![Mathematical equation: $\[\chi_{\text {red;pl}}^{2}<\chi_{\text {red;bb}}^{2}\]$](/articles/aa/full_html/2025/12/aa55294-25/aa55294-25-eq6.png) . The photon indices range from −2.1 to 7.0, and most sources have photon indices <0 or >3, where the latter values indicate spectra dominated by the Wien tail of a blackbody. For the four foreground stars and foreground star candidates with statistically acceptable fits with the absorbed blackbody model (917, 1389, 1654, and 1678), we find temperatures of 0.011 ± 0.006, 0.014 ± 0.009, 0.084 ± 0.076, and 3.00 ± 0.43 keV, respectively. The presence of strong emission lines in the UV spectra of some stellar types (e.g. Bai et al. 2018) can hinder obtaining formally acceptable fits with simple absorbed power-law or blackbody models.
. The photon indices range from −2.1 to 7.0, and most sources have photon indices <0 or >3, where the latter values indicate spectra dominated by the Wien tail of a blackbody. For the four foreground stars and foreground star candidates with statistically acceptable fits with the absorbed blackbody model (917, 1389, 1654, and 1678), we find temperatures of 0.011 ± 0.006, 0.014 ± 0.009, 0.084 ± 0.076, and 3.00 ± 0.43 keV, respectively. The presence of strong emission lines in the UV spectra of some stellar types (e.g. Bai et al. 2018) can hinder obtaining formally acceptable fits with simple absorbed power-law or blackbody models.
UV Spectra are available for the 42 sources classified only as hard. We obtained statistically acceptable fits for 13 of these: 11 with the absorbed power-law model and five with the absorbed blackbody model. For three of the 13 sources, both models provide statistically acceptable fits. For two of these (447 and 1590) ![Mathematical equation: $\[\chi_{\text {red;pl}}^{2}<\chi_{\text {red;bb}}^{2}\]$](/articles/aa/full_html/2025/12/aa55294-25/aa55294-25-eq7.png) , whereas for the remaining one (1140)
, whereas for the remaining one (1140) ![Mathematical equation: $\[\chi_{\text {red;bb}}^{2}< \chi_{\text {red;pl}}^{2}\]$](/articles/aa/full_html/2025/12/aa55294-25/aa55294-25-eq8.png) .
.
5.2 X-ray spectra
For 206 sources, X-ray spectra are available from the XMM-Newton source catalogue 4XMM-DR11. Within the XMM2Athena project, we obtained formally acceptable fits with an absorbed power-law model for 199 sources. X-ray spectra are available for seven sources that are classified as an AGN. All seven sources show statistically acceptable power-law fits. Their (averaged) median photon indices range between 1.7 and 2.1, and one source (745) shows a photon index of 2.7. For this source, the photon index varies with a significance of 3.3σ, but the observed variability remains low, by a factor of only 1.1. The photon indices of the remaining sources and the other spectral parameters remain stable, with a significance of variability below 3σ.
Nine sources that are classified as galaxies or galaxy candidates have X-ray spectra, and all nine have formally acceptable power-law fits. The photon indices show a broad distribution with values ranging from 0.75 to 4.43. They remain stable, with a variability significance below 2.5σ. For one source (1634), the flux varies by a factor of 3.5 with a significance of 6.7σ, while the foreground absorption varies by a factor of 19.9 but with a lower significance of 1.6σ. This variation results from one observation that includes both pn and MOS spectra, where the flux is higher and the foreground absorption lower than in the other observations, which only include MOS spectra.
Nine sources classified as supernova remnants or supernova remnant candidates have X-ray spectra, and all nine can be fitted statistically acceptable with a power-law model. The (averaged) median photon indices range from 2.7 to 5.5, except for one source (1156), which has a median photon index of 1.5 but an upper error consistent with values up to 3.7. Overall, the photon indices are consistent with a source dominated by thermal emission. The spectral parameters remain stable, with variability significances below 3σ, except for one source (1066). For this source, the median flux varies by a factor of 18.3 with a significance of 9.0σ, the median foreground absorption by a factor of 9.4 with a significance of 2.8σ, and the median of the photon index by a factor of 3.3 with a significance of 4.1σ (Fig. 6).
Four sources classified as supersoft have X-ray spectra, and three of them show statistically acceptable fits with the absorbed power-law model. The median photon indices are 3.9, 5.6, and 5.8, consistent with a soft thermal spectrum. Since the three sources are only observed once, no variability information is available.
All 24 sources classified as globular clusters or globular cluster candidates have X-ray spectra, and all show statistically acceptable power-law fits. The (averaged) median photon indices lie between 0.5 and 2.5. For three sources (855, 1267, and 1463), the variability significance exceeds 3, with variability factors ranging from 1.2 to 1.5. Only one source (946) shows a significant variation in foreground absorption (4.9σ) by a factor of 1.8. Fourteen sources show significant flux variations, from 1.2 to 25.6.
The five sources classified as X-ray binaries or X-ray binary candidates all have X-ray spectra that can be fitted with statistically acceptable absorbed power-law models. The obtained photon indices range from 1.6 to 2.1, except for source 1598, which has a photon index of 3.2, although its broad parameter range encompasses values observed for the other four sources. This relatively high photon index of source 1598 supports its classification as a very faint galaxy, as suggested by Williams et al. (2018, ; see above). For an X-ray binary, such a photon index would be expected when the system is in the high-soft state, dominated by thermal emission from the accretion disc. No variability above 3σ is observed for any of the parameters.
X-ray spectra are available for five of the six sources suggested as high-mass X-ray binaries by Williams et al. (2018). For these five sources, an absorbed power-law model provides a formally acceptable fit. The photon indices lie between 1.6 and 2.0, consistent with the values expected for high-mass X-ray binaries, except for source 1450, which has a quite low photon index of 0.32. We detect no variability above 3σ of the photon index or foreground absorption for any of these sources. The median fluxes of sources 1440 and 1636 show significant variability, with significances of 3.5 and 3.4σ and factors of 2.4 and 3.0, respectively.
Of the 100 sources classified as foreground stars or foreground star candidates, X-ray spectra are available for 68 within the XMM-Newton source catalogue. The absorbed power-law mode provides a statistically acceptable fit for 65 of these sources. The (averaged) median photon indices lie between 0.75 and 5.96 with 87.7 per cent of the sources having a photon index ≥3. For three sources (603, 917, and 1449), the median photon index varies by more than 3σ, with factors between 2.1 and 2.9. Only one foreground star (603) exhibits a variable absorption, with a factor of 37.3 and a significance exceeding 3σ. For four sources (917, 960, 1269, and 1449), the median flux varies by more than 3σ, with variability factors ranging from 3.4 to 119.7 (Fig. 6). The foreground star candidate with the highest variability factor (960) also exhibits a high variability significance at 19.8σ. This large change in flux occurs because the source shows a strong flare in its brightest observation (Fig. 7). The flare also leads to a harder spectrum; however, the change in photon index remains insignificant (only 1.2σ).
Of the 112 sources that can only be classified as hard, 75 sources have X-ray spectra in the 4XMM-DR11 catalogue. Formally acceptable power-law fits are obtained for 73 of these sources. The obtained (averaged) median photon indices range from 0.9 to 4.0, except for one source (805) that has a median photon index of ![Mathematical equation: $\[0.34_{-0.30}^{+0.84}\]$](/articles/aa/full_html/2025/12/aa55294-25/aa55294-25-eq9.png) . No source exhibits a significant variable photon index or foreground absorption. Three hard sources (394, 925, and 1203) have a flux variability above 3σ. The variability factor lies between 2.6 and 6.2.
. No source exhibits a significant variable photon index or foreground absorption. Three hard sources (394, 925, and 1203) have a flux variability above 3σ. The variability factor lies between 2.6 and 6.2.
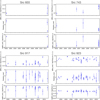 |
Fig. 6 Long-term X-ray light curves showing the evolution of the photon index and foreground absorption for source that exhibit strong variability with high significance in at least one parameter. Each data point represents one XMM-Newton observation. continued. |
5.3 SEDs
We fit 320 SEDs successfully, while the remaining five SEDs contain too few data points to fit. Of the 100 foreground stars and candidate, the SEDs of nine sources are best fitted with a blackbody model, while the SEDs of all other foreground stars can be well fitted with one of the stellar atmosphere models. For one of these nine sources (source 842), the shape of the SED resembles that of some supernova remnants more than that of foreground stars. Interestingly, this source was originally proposed as a supernova remnant candidate by Pietsch et al. (2005). For another source (source 1676), the SED shape resembles that of a star; however, the model and data points appear systematically shifted against each other. Both the best-fit blackbody model and the second best-fit BT-Settle model give formally highly unacceptable fits. One reason may be that the source is a blend of two stars (see Stiele et al. 2011). In the SIMBAD database, the source is listed as a high-mass X-ray binary; however, its SED shape clearly differs from that seen for high-mass X-ray binary candidates in Williams et al. (2018). The remaining seven sources, some of whose SEDs have quite a few data points, are listed as stars in the SIMBAD database.
Among the 112 XMM-Newton sources with UVIT counterparts classified as hard, nine sources (source 236, 379, 447, 1043, 1140, 1182, 1307, 1502, and 1590) have SEDs resembling those of foreground stars and where the best-fit model is a stellar atmosphere model. Of these sources, the following are listed as stars in the SIMBAD database: 236, 447, 1043, 1502, and 1590. Source 1502 has already been suggested as a foreground star candidate based on its location in the UVIT colour-colour diagram (see Fig. 1). For source 1203, classified as an X-ray binary candidate by Hofmann et al. (2013), the SED shape resembles that of a supernova remnant more than that of an X-ray binary. Halliday et al. (2006) classify it as a planetary nebula candidate. Source 1538 is suggested as an X-ray binary candidate by Lazzarini et al. (2021) and here the shape of the SED is similar to that seen in other sources classified as an X-ray binary in our sample. Rao et al. (2013) classify source 1864 as a quasar. Source 1941 is listed as a star in the SIMBAD database. The SED has only a few points and is best fitted with a blackbody model with an effective temperature of 19 700 K, which exceeds that of any source classified as a foreground star in our sample. In addition, the obtained absorption clearly exceeds the value adopted for the Galactic foreground absorption.
The overall shape of the SEDs of globular clusters resembles those of stars. Many SEDs display a roughly straight line that increases towards lower wavelengths between ~4 × 10³−6 × 10³Å. For source 1728, which can be classified either as a galaxy (Williams et al. 2018) or as a globular cluster (Johnson et al. 2012), we find two possible counterparts in the OM catalogue. For one of these counterparts (source 169483), the SED shape resembles that of a galaxy more than that of a globular cluster. For the other possible counterpart (source 169400), the case is less clear, as the SED has only a few data points.
For galaxies, the SEDs primarily exhibit two distinct shapes. Some SEDs appear to follow a blackbody at shorter wavelengths, while showing excess emission at longer wavelengths (above 1 × 10⁴Å). For other SEDs, the data points are closer to a straight line. The SEDs of sources 1598 and 1624 belong to the second group; therefore, they do not help determine whether the sources are a galaxy (candidate) (Williams et al. 2018) or an X-ray binary (Sasaki et al. 2018), since X-ray binaries can show similar SEDs.
It is difficult to provide a simple description of the overall SED shape for the five sources classified as X-ray binaries, as most have only a few data points. For the seven counterparts of sources classified as high-mass X-ray binary candidates, the SEDs of all but one are best fitted with the blackbody model, although the fits are formally unacceptable. This occurs because the SEDs show excess emission compared to the fitted blackbody at both ends: at wavelengths below 3 × 10³ Å and above 1 × 10⁴ Å.
We find that almost all counterparts of sources classified as supernova remnants (candidate) are best fitted with a blackbody model, which accurately describes the spectrum at shorter wavelengths, while excess emission appears at longer wavelengths (above ~1 × 10⁴ Å). For all but one, the SEDs of sources classified as AGNs are best fitted with the blackbody model, although the fits are formally unacceptable, and display an SED shape similar to that of high-mass X-ray binary candidates. The SEDs of supersoft-source counterparts vary in the number of available data points and overall shapes, resulting in different best-fit models.
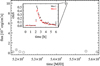 |
Fig. 7 Long-term X-ray light curve of source 960, a foreground star candidate, which shows a strong flare in one observation. Each data point represents one XMM-Newton observation. In the inset, the light curve of the brightest observation is shown with a bin size of 0.5 ks. |
6 Summary and conclusion
For X-ray source from the Deep XMM-Newton survey of M 31 (Stiele et al. 2011) for which we obtained UV counterparts from the Astrosat M 31 UVIT catalogue (Leahy et al. 2020), we studied the colours and spectra of the counterparts in the UVIT bands and investigated their SEDs, including counterparts from the XMM-Newton Optical Monitoring Serendipitous Ultraviolet Source Survey catalogue (Page et al. 2012) and from a catalogue search using the SED fitting tool VOSA. We also analysed the spectral properties in the X-ray band and their variability based on the spectral fit catalogue published by the XMM2Athena project.
In this study, we provide updated classifications for 24 sources from the deep XMM-Newton survey of M 31. Most of these sources had previously been classified as ‘hard’ by (Stiele et al. 2011). We reclassified five of these hard sources as foreground star candidates. Based on its location in the UVIT colour-colour diagram (see Fig. 1), its SED being best fitted with a stellar atmosphere model, and considering that it is already listed as a foreground star within SIMBAD, we reclassify source 1502 as a foreground star. Four additional sources, 236, 447, 1043, and 1590, also have a stellar atmosphere model as the best-fit model of their SEDs and are listed as foreground stars within SIMBAD. We confirm that source 960 is a foreground star through the detection of a flare in one XMM-Newton observation (see Fig. 7).
The SED of source 842, classified as a foreground star candidate, more closely resembles that of a supernova remnant than a foreground star. This source was originally proposed as a supernova remnant candidate by Pietsch et al. (2005). For source 1203, classified as hard, the SED shape is more consistent with that of a supernova remnant than an X-ray binary. It has been alternatively proposed as a planetary nebula candidate by Halliday et al. (2006) and as an X-ray binary candidate by Hofmann et al. (2013). The SED of source 1538, classified as hard, and a potential X-ray binary candidate according to Lazzarini et al. (2021) shows a shape that resembles those of other X-ray binaries in our sample.
Sources 1598 and 1624 are classified as a galaxy and a galaxy candidate, respectively, by Williams et al. (2018), whereas Sasaki et al. (2018) classifies them as X-ray binaries. For these two sources, the SEDs do not help distinguish between the suggested classifications.
Data availability
The source catalogue (see Sect. 4.5) is available at the CDS via https://cdsarc.cds.unistra.fr/viz-bin/cat/J/A+A/704/A235.
Acknowledgements
HS acknowledges support by the project NRW-Cluster for data intensive radio astronomy: Big Bang to Big Data (B3D) funded through the programme “Profilbildung 2020”, an initiative of the Ministry of Culture and Science of the State of North Rhine-Westphalia. AKHK acknowledges support by the Ministry of Science and Technology of the Republic of China (Taiwan) through grants 110-2628-M-007-005 and 111-2112-M-007-020. Based on source catalogues obtained from XMM-Newton observations, an ESA science mission with instruments and contributions directly funded by ESA Member States and NASA. This publication uses a source catalogue that is based on data from the AstroSat mission of the Indian Space Research Organisation (ISRO), archived at the Indian Space Science Data Centre (ISSDC). This research has made use of the software tool TOPCAT (http://www.starlink.ac.uk/topcat/). This publication makes use of VOSA, developed under the Spanish Virtual Observatory (https://svo.cab.inta-csic.es) project funded by MCIN/AEI/10.13039/501100011033/ through grant PID2020-112949GB-I00. VOSA has been partially updated by using funding from the European Union’s Horizon 2020 Research and Innovation Programme, under Grant Agreement no 776403 (EXOPLANETS-A).
References
- Allard, F., Hauschildt, P. H., Alexander, D. R., & Starrfield, S. 1997, A&A, 35, 137 [Google Scholar]
- Allard, F., Hauschildt, P. H., Alexander, D. R., Tamanai, A., & Schweitzer, A. 2001, ApJ, 556, 357 [Google Scholar]
- Allard, F., Homeier, D., & Freytag, B. 2012, in From Interacting Binaries to Exoplanets: Essential Modeling Tools, 282, eds. M. T. Richards, & I. Hubeny, 235 [Google Scholar]
- Arnaud, K. A. 1996, in Astronomical Society of the Pacific Conference Series, 101, Astronomical Data Analysis Software and Systems V, eds. G. H. Jacoby, & J. Barnes, 17 [Google Scholar]
- Bai, Y., Liu, J., Wicker, J., et al. 2018, ApJS, 235, 16 [NASA ADS] [CrossRef] [Google Scholar]
- Baraffe, I., Chabrier, G., Allard, F., & Hauschildt, P. H. 1997, A&A, 327, 1054 [Google Scholar]
- Baraffe, I., Chabrier, G., Allard, F., & Hauschildt, P. H. 1998, A&A, 337, 403 [Google Scholar]
- Baraffe, I., Chabrier, G., Barman, T. S., Allard, F., & Hauschildt, P. H. 2003, A&A, 402, 701 [NASA ADS] [CrossRef] [EDP Sciences] [Google Scholar]
- Bayo, A., Rodrigo, C., Barrado Y Navascués, D., et al. 2008, A&A, 492, 277 [NASA ADS] [CrossRef] [EDP Sciences] [Google Scholar]
- Carrera, F. J., & Stiele, H. 2022, https://doi.org/10.5281/zenodo.15193427 [Google Scholar]
- Castelli, F., & Kurucz, R. L. 2003, in Modelling of Stellar Atmospheres, 210, eds. N. Piskunov, W. W. Weiss, & D. F. Gray, A20 [Google Scholar]
- Castelli, F., Gratton, R. G., & Kurucz, R. L. 1997, A&A, 318, 841 [NASA ADS] [Google Scholar]
- Coelho, P. R. T. 2014, MNRAS, 440, 1027 [Google Scholar]
- Collura, A., Reale, F., & Peres, G. 1990, ApJ, 356, 119 [Google Scholar]
- Dalcanton, J. J., Williams, B. F., Lang, D., et al. 2012, ApJS, 200, 18 [Google Scholar]
- Di Stefano, R., Kong, A. K. H., Garcia, M. R., et al. 2002, ApJ, 570, 618 [Google Scholar]
- Di Stefano, R., Kong, A. K. H., Greiner, J., et al. 2004, ApJ, 610, 247 [Google Scholar]
- Garcia, M. R., Murray, S. S., Primini, F. A., et al. 2000, ApJ, 537, L23 [Google Scholar]
- Grevesse, N., Noels, A., & Sauval, A. J. 1993, A&A, 271, 587 [NASA ADS] [Google Scholar]
- Halliday, C., Carter, D., Bridges, T. J., et al. 2006, MNRAS, 369, 97 [Google Scholar]
- Hauschildt, P. H., Allard, F., & Baron, E. 1999, ApJ, 512, 377 [Google Scholar]
- Henze, M., Pietsch, W., Haberl, F., et al. 2010, A&A, 523, A89 [NASA ADS] [CrossRef] [EDP Sciences] [Google Scholar]
- Henze, M., Pietsch, W., Haberl, F., et al. 2011, A&A, 533, A52 [NASA ADS] [CrossRef] [EDP Sciences] [Google Scholar]
- Henze, M., Pietsch, W., Haberl, F., et al. 2014, A&A, 563, A2 [NASA ADS] [CrossRef] [EDP Sciences] [Google Scholar]
- Hofmann, F., Pietsch, W., Henze, M., et al. 2013, A&A, 555, A65 [NASA ADS] [CrossRef] [EDP Sciences] [Google Scholar]
- Jansen, F., Lumb, D., Altieri, B., et al. 2001, A&A, 365, L1 [NASA ADS] [CrossRef] [EDP Sciences] [Google Scholar]
- Johnson, L. C., Seth, A. C., Dalcanton, J. J., et al. 2012, ApJ, 752, 95 [CrossRef] [Google Scholar]
- Johnson, L. C., Seth, A. C., Dalcanton, J. J., et al. 2015, ApJ, 802, 127 [NASA ADS] [CrossRef] [Google Scholar]
- Kaaret, P. 2002, ApJ, 578, 114 [NASA ADS] [CrossRef] [Google Scholar]
- Kang, Y., Bianchi, L., & Rey, S.-C. 2009, ApJ, 703, 614 [Google Scholar]
- Kang, Y., Rey, S.-C., Bianchi, L., et al. 2012, ApJS, 199, 37 [Google Scholar]
- Koester, D. 2010, Mem. Soc. Astron. Italiana, 81, 921 [NASA ADS] [Google Scholar]
- Kong, A. K. H., Garcia, M. R., Primini, F. A., et al. 2002, ApJ, 577, 738 [Google Scholar]
- Lazzarini, M., Williams, B. F., Durbin, M., et al. 2021, ApJ, 906, 120 [NASA ADS] [CrossRef] [Google Scholar]
- Leahy, D. A., & Chen, Y. 2020, ApJS, 250, 23 [Google Scholar]
- Leahy, D. A., Postma, J., Chen, Y., & Buick, M. 2020, ApJS, 247, 47 [NASA ADS] [CrossRef] [Google Scholar]
- McConnachie, A. W., Irwin, M. J., Ferguson, A. M. N., et al. 2005, MNRAS, 356, 979 [NASA ADS] [CrossRef] [Google Scholar]
- Maccarone, T. J., Yukita, M., Hornschemeier, A., et al. 2016, MNRAS, 458, 3633 [NASA ADS] [CrossRef] [Google Scholar]
- Morley, C. V., Fortney, J. J., Marley, M. S., et al. 2012, ApJ, 756, 172 [NASA ADS] [CrossRef] [Google Scholar]
- Morley, C. V., Marley, M. S., Fortney, J. J., & Lupu, R. 2014a, ApJ, 789, L14 [NASA ADS] [CrossRef] [Google Scholar]
- Morley, C. V., Marley, M. S., Fortney, J. J., et al. 2014b, ApJ, 787, 78 [Google Scholar]
- Morrissey, P., Conrow, T., Barlow, T. A., et al. 2007, ApJS, 173, 682 [Google Scholar]
- Orio, M., Nelson, T., Bianchini, A., Di Mille, F., & Harbeck, D. 2010, ApJ, 717, 739 [CrossRef] [Google Scholar]
- Osborne, J. P., Borozdin, K. N., Trudolyubov, S. P., et al. 2001, A&A, 378, 800 [NASA ADS] [CrossRef] [EDP Sciences] [Google Scholar]
- Pacheco, T. A., Diaz, M. P., Levenhagen, R. S., & Coelho, P. R. T. 2021, ApJS, 256, 41 [Google Scholar]
- Page, M. J., Brindle, C., Talavera, A., et al. 2012, MNRAS, 426, 903 [NASA ADS] [CrossRef] [Google Scholar]
- Partridge, H., & Schwenke, D. W. 1997, J. Chem. Phys., 106, 4618 [NASA ADS] [CrossRef] [Google Scholar]
- Phillips, M. W., Tremblin, P., Baraffe, I., et al. 2020, A&A, 637, A38 [NASA ADS] [CrossRef] [EDP Sciences] [Google Scholar]
- Pietsch, W., Freyberg, M., & Haberl, F. 2005, A&A, 434, 483 [NASA ADS] [CrossRef] [EDP Sciences] [Google Scholar]
- Pietsch, W., Haberl, F., Sala, G., et al. 2007, A&A, 465, 375 [NASA ADS] [CrossRef] [EDP Sciences] [Google Scholar]
- Primini, F. A., Forman, W., & Jones, C. 1993, ApJ, 410, 615 [NASA ADS] [CrossRef] [Google Scholar]
- Rao, S. M., Sardane, G., Turnshek, D. A., et al. 2013, MNRAS, 432, 866 [Google Scholar]
- Rauch, T., & Deetjen, J. L. 2003, in Astronomical Society of the Pacific Conference Series, 288, Stellar Atmosphere Modeling, eds. I. Hubeny, D. Mihalas, & K. Werner, 103 [Google Scholar]
- Sargent, B. A., Srinivasan, S., & Meixner, M. 2011, ApJ, 728, 93 [NASA ADS] [CrossRef] [Google Scholar]
- Sasaki, M., Haberl, F., Henze, M., et al. 2018, A&A, 620, A28 [NASA ADS] [CrossRef] [EDP Sciences] [Google Scholar]
- Saumon, D., Marley, M. S., Abel, M., Frommhold, L., & Freedman, R. S. 2012, ApJ, 750, 74 [Google Scholar]
- Schryber, J. H., Miller, S., & Tennyson, J. 1995, J. Quant. Spec. Radiat. Transf., 53, 373 [Google Scholar]
- Singh, K. P., Tandon, S. N., Agrawal, P. C., et al. 2014, SPIE Conf. Ser., 9144, 91441S [Google Scholar]
- Stark, A. A., Gammie, C. F., Wilson, R. W., et al. 1992, ApJS, 79, 77 [Google Scholar]
- Stiele, H., & Kong, A. K. H. 2018, MNRAS, 475, 4911 [Google Scholar]
- Stiele, H., Pietsch, W., Haberl, F., & Freyberg, M. 2008, A&A, 480, 599 [NASA ADS] [CrossRef] [EDP Sciences] [Google Scholar]
- Stiele, H., Pietsch, W., Haberl, F., et al. 2011, A&A, 534, A55 [NASA ADS] [CrossRef] [EDP Sciences] [Google Scholar]
- Strüder, L., Briel, U., Dennerl, K., et al. 2001, A&A, 365, L18 [Google Scholar]
- Supper, R., Hasinger, G., Pietsch, W., et al. 1997, A&A, 317, 328 [NASA ADS] [Google Scholar]
- Supper, R., Hasinger, G., Lewin, W. H. G., et al. 2001, A&A, 373, 63 [NASA ADS] [CrossRef] [EDP Sciences] [Google Scholar]
- Tandon, S. N., Subramaniam, A., Girish, V., et al. 2017, AJ, 154, 128 [NASA ADS] [CrossRef] [Google Scholar]
- Thilker, D. A., Hoopes, C. G., Bianchi, L., et al. 2005, ApJ, 619, L67 [Google Scholar]
- Tremblay, P. E., & Bergeron, P. 2009, ApJ, 696, 1755 [Google Scholar]
- Trinchieri, G., & Fabbiano, G. 1991, ApJ, 382, 82 [Google Scholar]
- Turner, M. J. L., Abbey, A., Arnaud, M., et al. 2001, A&A, 365, L27 [CrossRef] [EDP Sciences] [Google Scholar]
- van Speybroeck, L., Epstein, A., Forman, W., et al. 1979, ApJ, 234, L45 [Google Scholar]
- Viitanen, A., Mountrichas, G., Stiele, H., et al. 2025, A&A, 704, A16 [NASA ADS] [CrossRef] [EDP Sciences] [Google Scholar]
- Voss, R., & Gilfanov, M. 2007, A&A, 468, 49 [NASA ADS] [CrossRef] [EDP Sciences] [Google Scholar]
- Webb, N. A., Carrera, F., Schwope, A., et al. 2023, Astron. Nachr., 344, 20102 [Google Scholar]
- Webb, N. A., Coriat, M., Traulsen, I., et al. 2020, A&A, 641, A136 [NASA ADS] [CrossRef] [EDP Sciences] [Google Scholar]
- Werner, K. & Dreizler, S. 1999, J. Computat. Appl. Math., 109, 65 [NASA ADS] [CrossRef] [Google Scholar]
- Werner, K., Deetjen, J. L., Dreizler, S., et al. 2003, in Astronomical Society of the Pacific Conference Series, 288, Stellar Atmosphere Modeling, eds. I. Hubeny, D. Mihalas, & K. Werner, 31 [Google Scholar]
- Williams, B. F., Garcia, M. R., Kong, A. K. H., et al. 2004, ApJ, 609, 735 [Google Scholar]
- Williams, B. F., Hatzidimitriou, D., Green, J., et al. 2014, MNRAS, 443, 2499 [Google Scholar]
- Williams, B. F., Lazzarini, M., Plucinsky, P. P., et al. 2018, ApJS, 239, 13 [NASA ADS] [CrossRef] [Google Scholar]
- Yukita, M., Ptak, A., Hornschemeier, A. E., et al. 2017, ApJ, 838, 47 [Google Scholar]
This catalogue is available at https://nextcloud.ifca.es/index.php/s/m2gPp2ngPezqjCr and a description of it can be found at: https://zenodo.org/records/15193427; see also Viitanen et al. (2025).
Appendix A The individual columns of the results catalogue.
Source properties:
SPH2011: The identifier (source number) of the X-ray source taken from Stiele et al. (2011)
RAJ2000, DEJ2000: Right ascension and declination taken from Stiele et al. (2011)
ePos: Uncertainty in the position of the X-ray source from Stiele et al. (2011)
Class: Classification of the X-ray source
Astrosat UVIT bands:
The following nine columns are provided for each of the six UV bands in the Astrosat M 31 UVIT catalogue (Leahy et al. 2020). The index i runs from 1 to 6.
Filter_i Name of the UV filter
RAJ2000_i, DEJ2000_i: Position of the source in UV band i
ABmag_i, mag_ i, Errmag_i: Magnitude in UV band i in the AB and Vega system and error of the magnitude
Field_i: Field of the Astrosat M 31 UVIT catalogue that covers the position of the source
flux_i, flux_i_err: Flux and error of the flux in UV band i derived from the magnitude as described in Sect. 3.2
XMM-Newton X-ray bands:
The source flux with error in the five X-ray bands (i from 1 to 5) according to the 4XMM-DR11 catalogue (Webb et al. 2020). SRCID: Source identifier according to the 4XMM-DR11 catalogue
SC_EP_i_FLUX, SC_EP_i_FLUX_ERR: Flux with error in X-ray band i according to the 4XMM-DR11 catalogue
XMM-Newton OM bands:
The entries in the following 28 columns are taken from the SUSS catalogue (Page et al. 2012).
SRCNUM_OM: The identifier (source number) of the OM counterpart
RA_OM, DEC_OM: Right ascension and declination of the OM counterpart
POSERR_OM: Uncertainty in the position of the OM counterpart
In the next 24 columns the filter takes one of the following values: UVW2, UVM2, UVW1, U, B, V.
filter_AB_FLUX, filter_AB_FLUX_ERR: Flux and error of the flux in OM filter from the SUSS catalogue
filter_AB_MAG, filter_AB_MAG_ERR: Magnitude with error in OM filter in the AB system from the SUSS catalogue
GALEX bands:
The entries in the following 11 columns are taken from the GALEX globular cluster catalogue (Kang et al. 2012).
GCl_Name: The identifier of the GALEX counterpart
The next 10 columns give the magnitudes in the GALEX bands as filtermag, where filter takes one of the following values: FUV, NUV, U, B, V, R, I, J, H, Ks.
Astrosat UVIT spectral parameters:
The following 17 columns provide the spectral parameters with lower and upper error for each of the two models and the corresponding reduced χ2 value. The parameters (param) are foreground absorption (abs), photon index (phI), inner disc temperature (kT), and inner disc radius (r), for the power law (pl) and blackbody (bb) model (mod), respectively. The foreground absorption is described with the redden model, and fixed at a value of 0.21 if only two UVIT channels are available (see Sect. 3.2)
param_mod_uv: Value of the spectral parameter
param_mod_uv_lerr: Lower error on the spectral parameter
param_mod_uv_uerr: Upper error on the spectral parameter
chi2_red_mod_uv: Reduced χ2 value for that model
X-ray spectral parameters:
We provide the median (med) and mode (mod) with lower and upper boundaries for each of the four parameters (param): logarithm of the flux (lgflux), logarithm of the foreground absorption (lgnh), photon index (PhI), and inter-instrument normalisation (IIN; if needed). In addition the factor and significance of variability are given for each parameter (if the logarithm of a parameter is given, we use the non-logarithmic value here, and hence the “lg” is omitted in the name of that parameter). The parameters are obtained from the XMM2Athena project (Carrera & Stiele 2022; Viitanen et al. 2025).
param_med/mod: Median or mode of the parameter
param_med/mod_min, param_med/mod_max: Percentiles of 5 and 95 per cent in case of the median, and lower and upper limits of the 90 per cent credible interval in case of the mode param_med/mod_var: Variability factor of the (non-logarithmic) parameter (see Sect. 3.2)
param_med/mod_sig: Significance of variability of the (non-logarithmic) parameter (see Sect. 3.2)
pvalue: KS p-value of the source+background fit flag:
3: Formally unacceptable background fit
4: Formally unacceptable fit (pvalue < 0.01)
5: No X-ray spectrum available
0: None of the above issues occurred
UV to X-ray spectral parameters:
a_uvx, a_uvx_err: Photon index with error obtained from counts in the hardest UVIT and soft X-ray bands (see Sect. 3.2)
SED fitting parameters:
Model: Name of best fit model
Teff, e_Tefff: Effective temperature with error of the model in Kelvin
logg, e_logg: Logarithm of the surface gravity and its error
Meta, e_Meta: Metallicity with error for the model
Av, err_Av: Extinction with error used for dereddening the SED
more: values of additional model parameters (if any)
Chi2: Chi square of the fitting
Nfit: Number of data points used in the SED fitting
Ntot: Number of data points in the SED
Vgf, Vgfb: Visual goodness of fit: Modified reduced χ2 assuming observational errors of at least two or ten per cent, respectively.
Ftot, Ferr: Total flux of the source and its error based on the best fit model
MaxLam: Last wavelength (in Å) used in the SED fitting
excfit: Filter where infrared excess seems to start
All Figures
|
Fig. 1 Colour-colour UV diagram for X-ray sources with UV counterparts, plotting NUVB15 – NUVN2 AB magnitude on the x-axis vs. FUVCaF2 – NUVB15 AB magnitude on the y-axis. The different symbols and colours indicate the different updated source classifications. |
| In the text | |
|
Fig. 2 Distribution of the photon indices in the UV (red) and X-ray (blue) bands, as well as of the UV to X-ray photon indices (black). Filled bars indicate the distributions for sources with statistically acceptable fits. |
| In the text | |
|
Fig. 3 Number of sources with a UV spectrum and a formally acceptable fit (using either the power-law or blackbody model) for different classes. |
| In the text | |
|
Fig. 4 Correlation between the UV to X-ray photon index and the UV (red square) and X-ray (blue circle) photon indices. Filled symbols indicate sources with statistically acceptable fits. The line of equal indices is shown as a solid line. |
| In the text | |
|
Fig. 5 Distribution of temperatures obtained from SED fitting. |
| In the text | |
|
Fig. 6 Long-term X-ray light curves showing the evolution of the photon index and foreground absorption for source that exhibit strong variability with high significance in at least one parameter. Each data point represents one XMM-Newton observation. continued. |
| In the text | |
|
Fig. 7 Long-term X-ray light curve of source 960, a foreground star candidate, which shows a strong flare in one observation. Each data point represents one XMM-Newton observation. In the inset, the light curve of the brightest observation is shown with a bin size of 0.5 ks. |
| In the text | |
Current usage metrics show cumulative count of Article Views (full-text article views including HTML views, PDF and ePub downloads, according to the available data) and Abstracts Views on Vision4Press platform.
Data correspond to usage on the plateform after 2015. The current usage metrics is available 48-96 hours after online publication and is updated daily on week days.
Initial download of the metrics may take a while.