Open Access
Fig. 4
Download original image
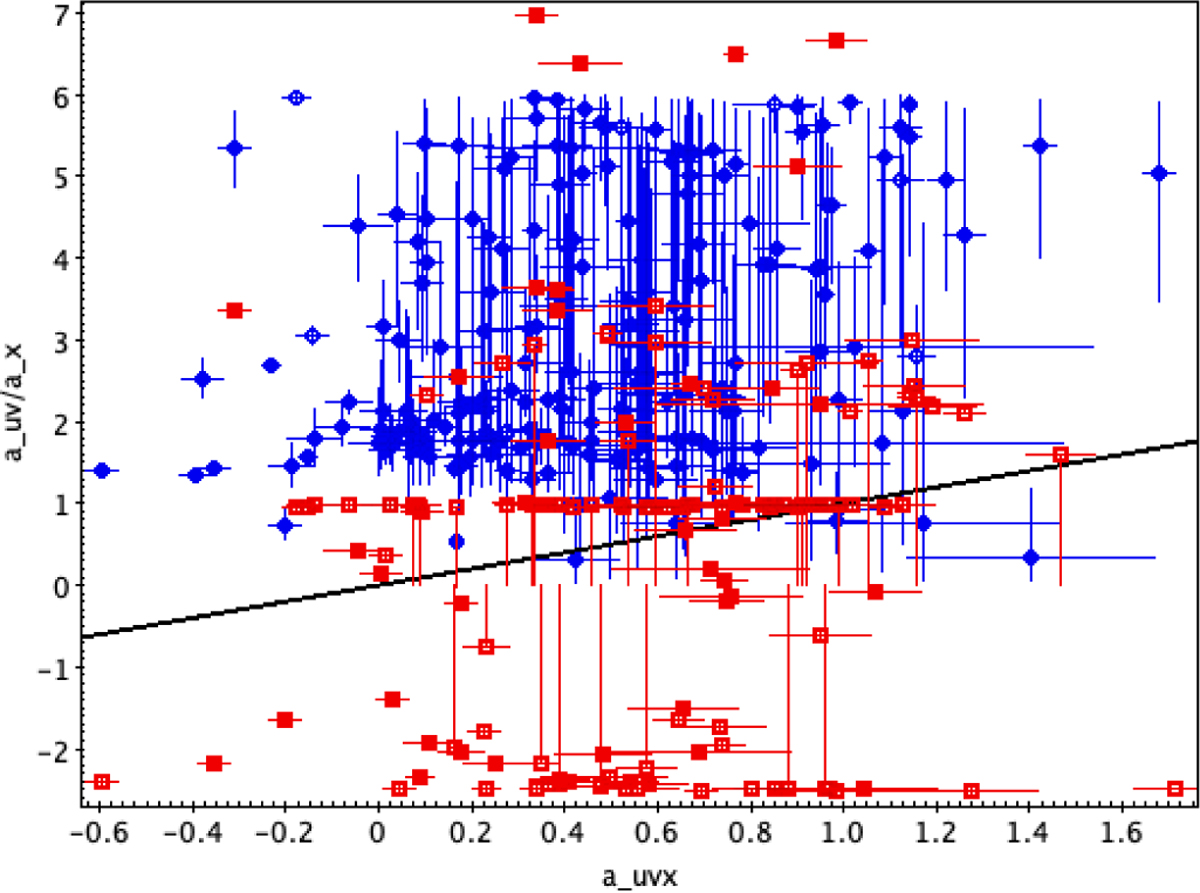
Correlation between the UV to X-ray photon index and the UV (red square) and X-ray (blue circle) photon indices. Filled symbols indicate sources with statistically acceptable fits. The line of equal indices is shown as a solid line.
Current usage metrics show cumulative count of Article Views (full-text article views including HTML views, PDF and ePub downloads, according to the available data) and Abstracts Views on Vision4Press platform.
Data correspond to usage on the plateform after 2015. The current usage metrics is available 48-96 hours after online publication and is updated daily on week days.
Initial download of the metrics may take a while.