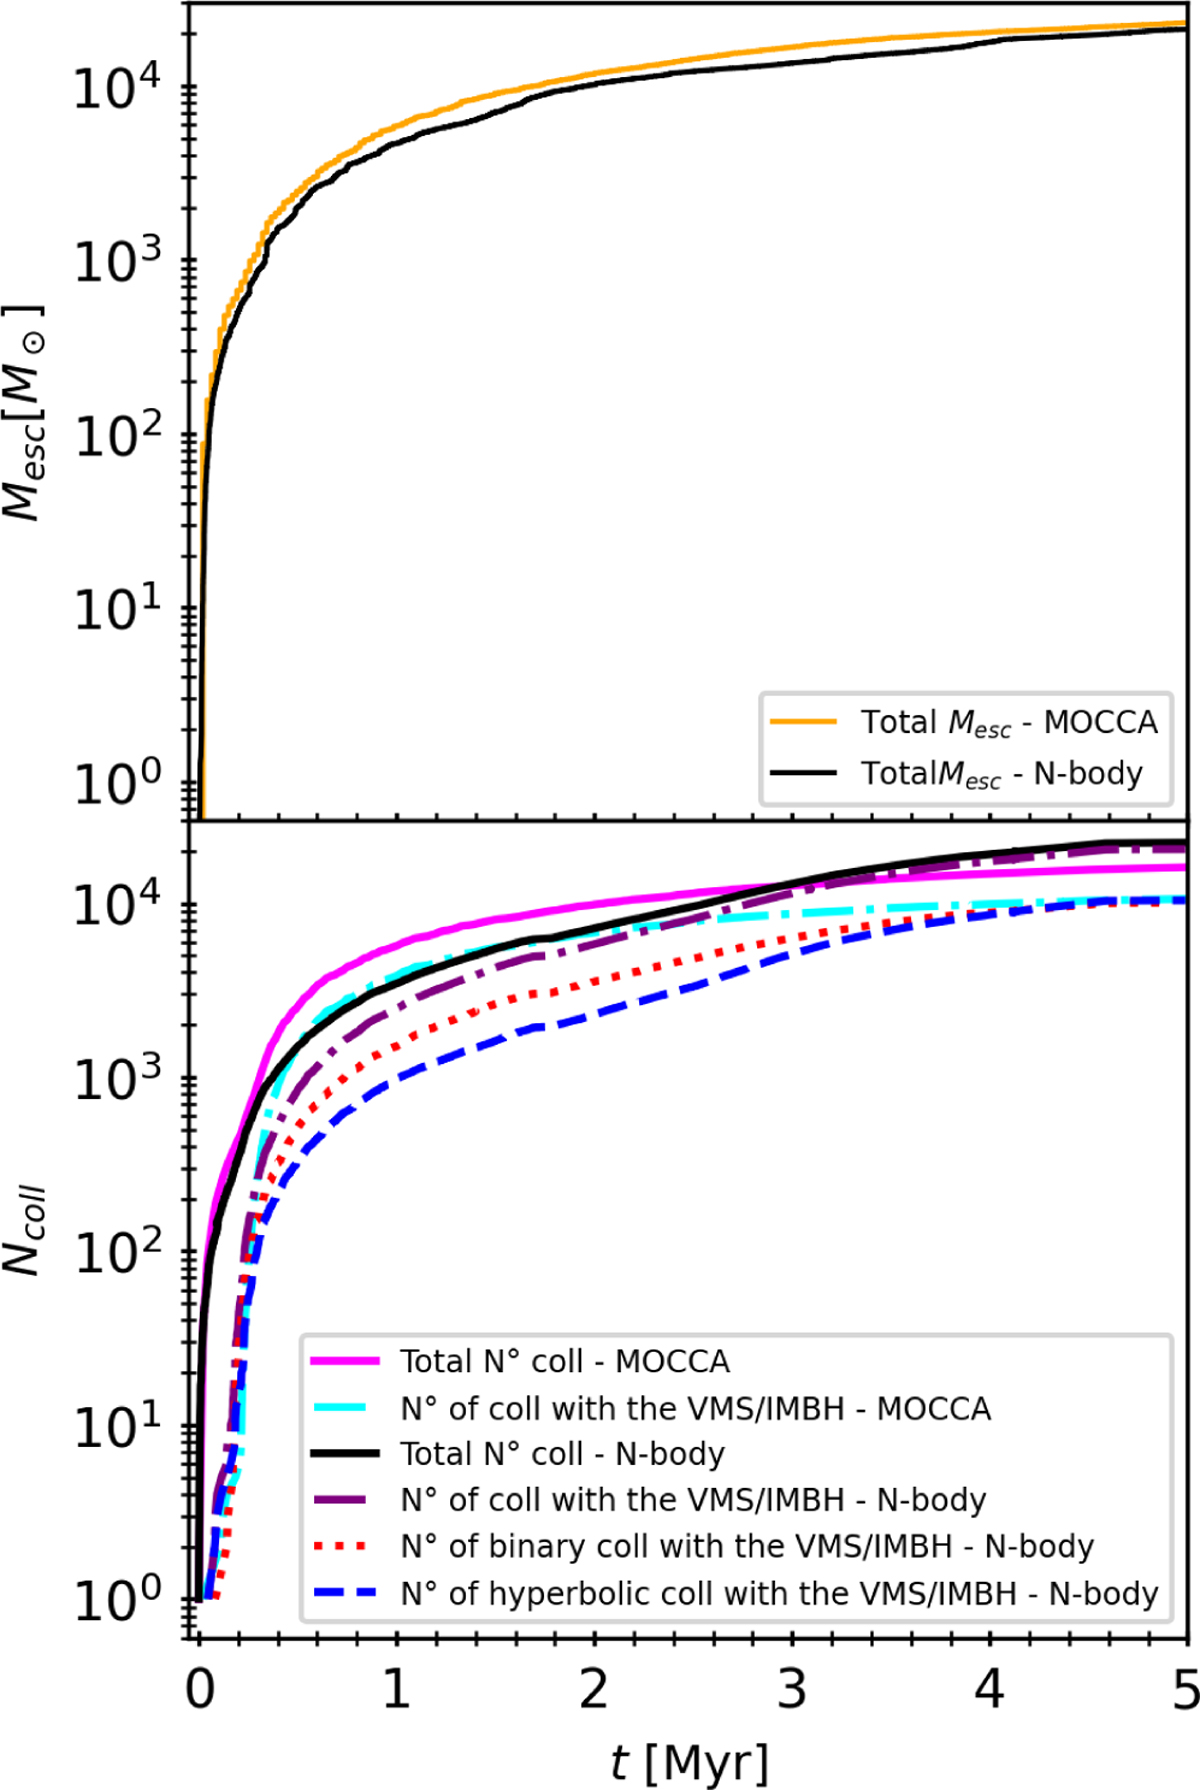
Fig. 3
Download original image
Cumulative mass of escapees (top panel) and cumulative number of collisions (bottom panel). The total number of collisions is represented by a solid black line (N-body) and solid magenta line (MOCCA), while collisions involving the VMS are shown with a dot-dashed purple line (N-body) and solid cyan line (MOCCA). The binaries involving the VMS are shown with a dotted red line, and hyperbolic collisions with the VMS are shown by a dashed blue line.
Current usage metrics show cumulative count of Article Views (full-text article views including HTML views, PDF and ePub downloads, according to the available data) and Abstracts Views on Vision4Press platform.
Data correspond to usage on the plateform after 2015. The current usage metrics is available 48-96 hours after online publication and is updated daily on week days.
Initial download of the metrics may take a while.