Open Access
Fig. 4
Download original image
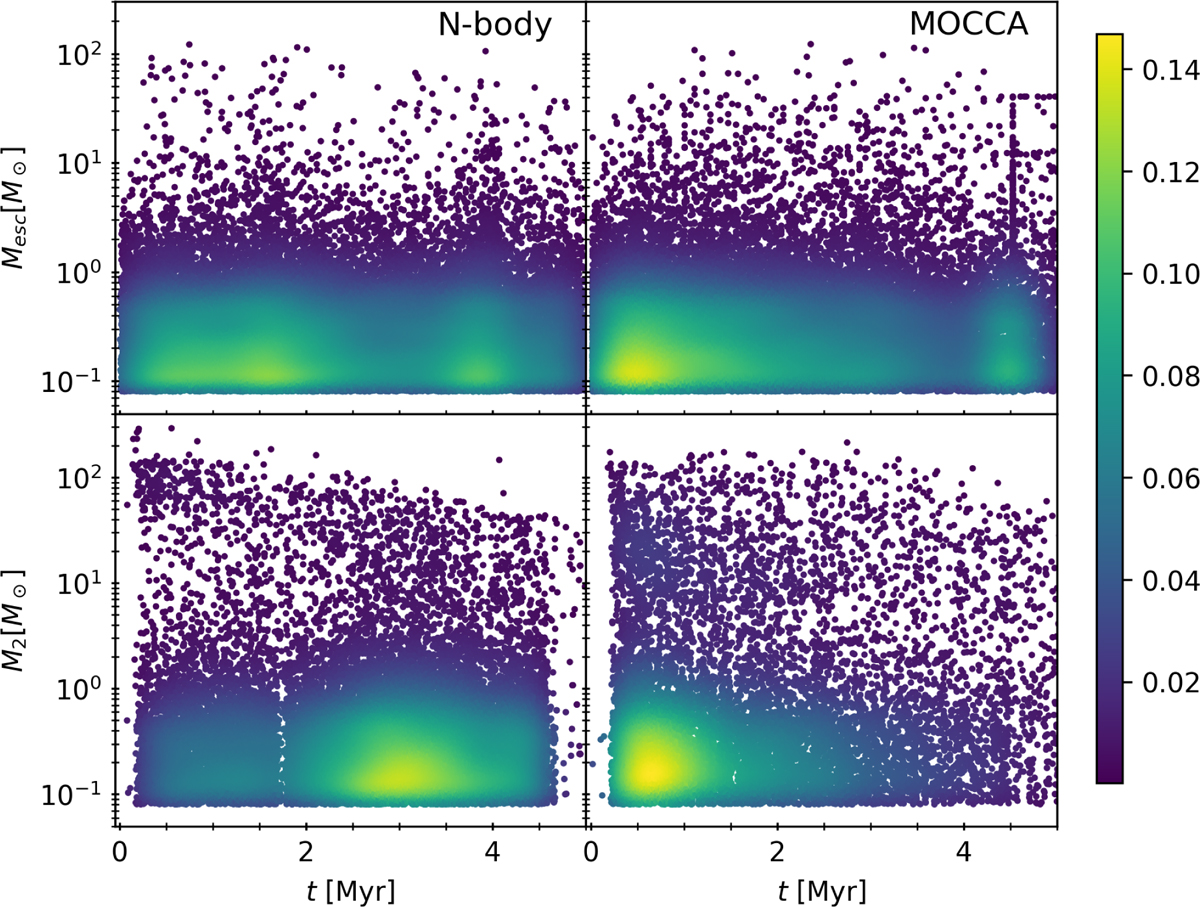
Top panels: mass of each escaping star. Bottom panels: mass of the secondary star before it collides with the VMS for hyperbolic and binary collisions. The color bar represents the density distribution of the stars.
Current usage metrics show cumulative count of Article Views (full-text article views including HTML views, PDF and ePub downloads, according to the available data) and Abstracts Views on Vision4Press platform.
Data correspond to usage on the plateform after 2015. The current usage metrics is available 48-96 hours after online publication and is updated daily on week days.
Initial download of the metrics may take a while.