Fig. 5
Download original image
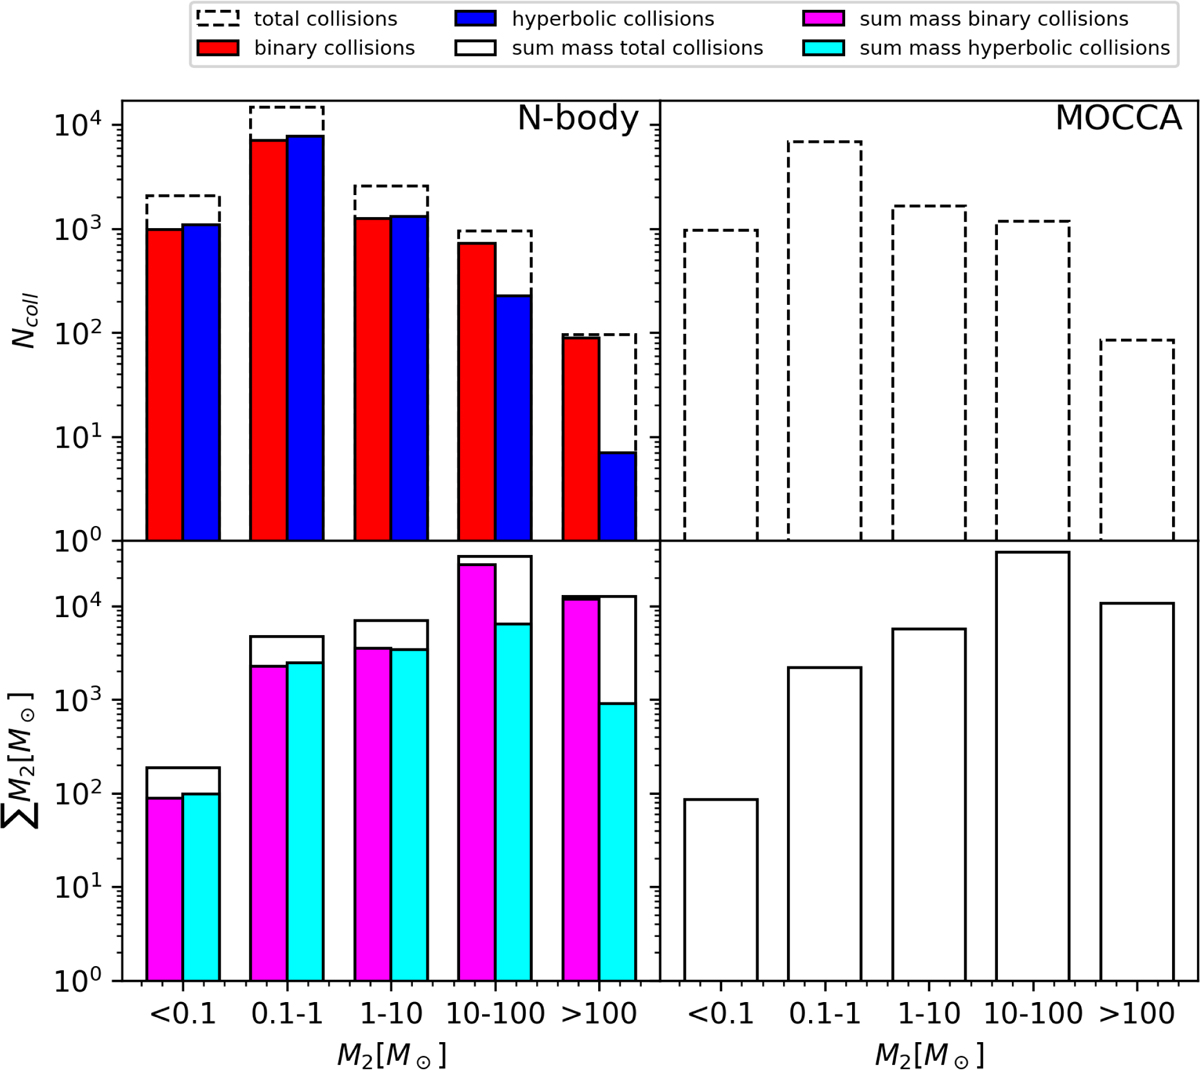
Histograms showing the contribution of colliding stars to VMS formation, divided into binary, hyperbolic, and total collisions. The mass ranges are < 0.1 M⊙, 0.1-1 M⊙, 1-10 M⊙, 10-100 M⊙, and > 100 M⊙. Results are shown for the N-body simulation (left column) and the MOCCA simulation (right column). The top panel displays the number of collisions, and the bottom panel shows the cumulative mass contributed by these collisions.
Current usage metrics show cumulative count of Article Views (full-text article views including HTML views, PDF and ePub downloads, according to the available data) and Abstracts Views on Vision4Press platform.
Data correspond to usage on the plateform after 2015. The current usage metrics is available 48-96 hours after online publication and is updated daily on week days.
Initial download of the metrics may take a while.